
PLE Grades the Engineering Deliverable an AI Agent Hands Back
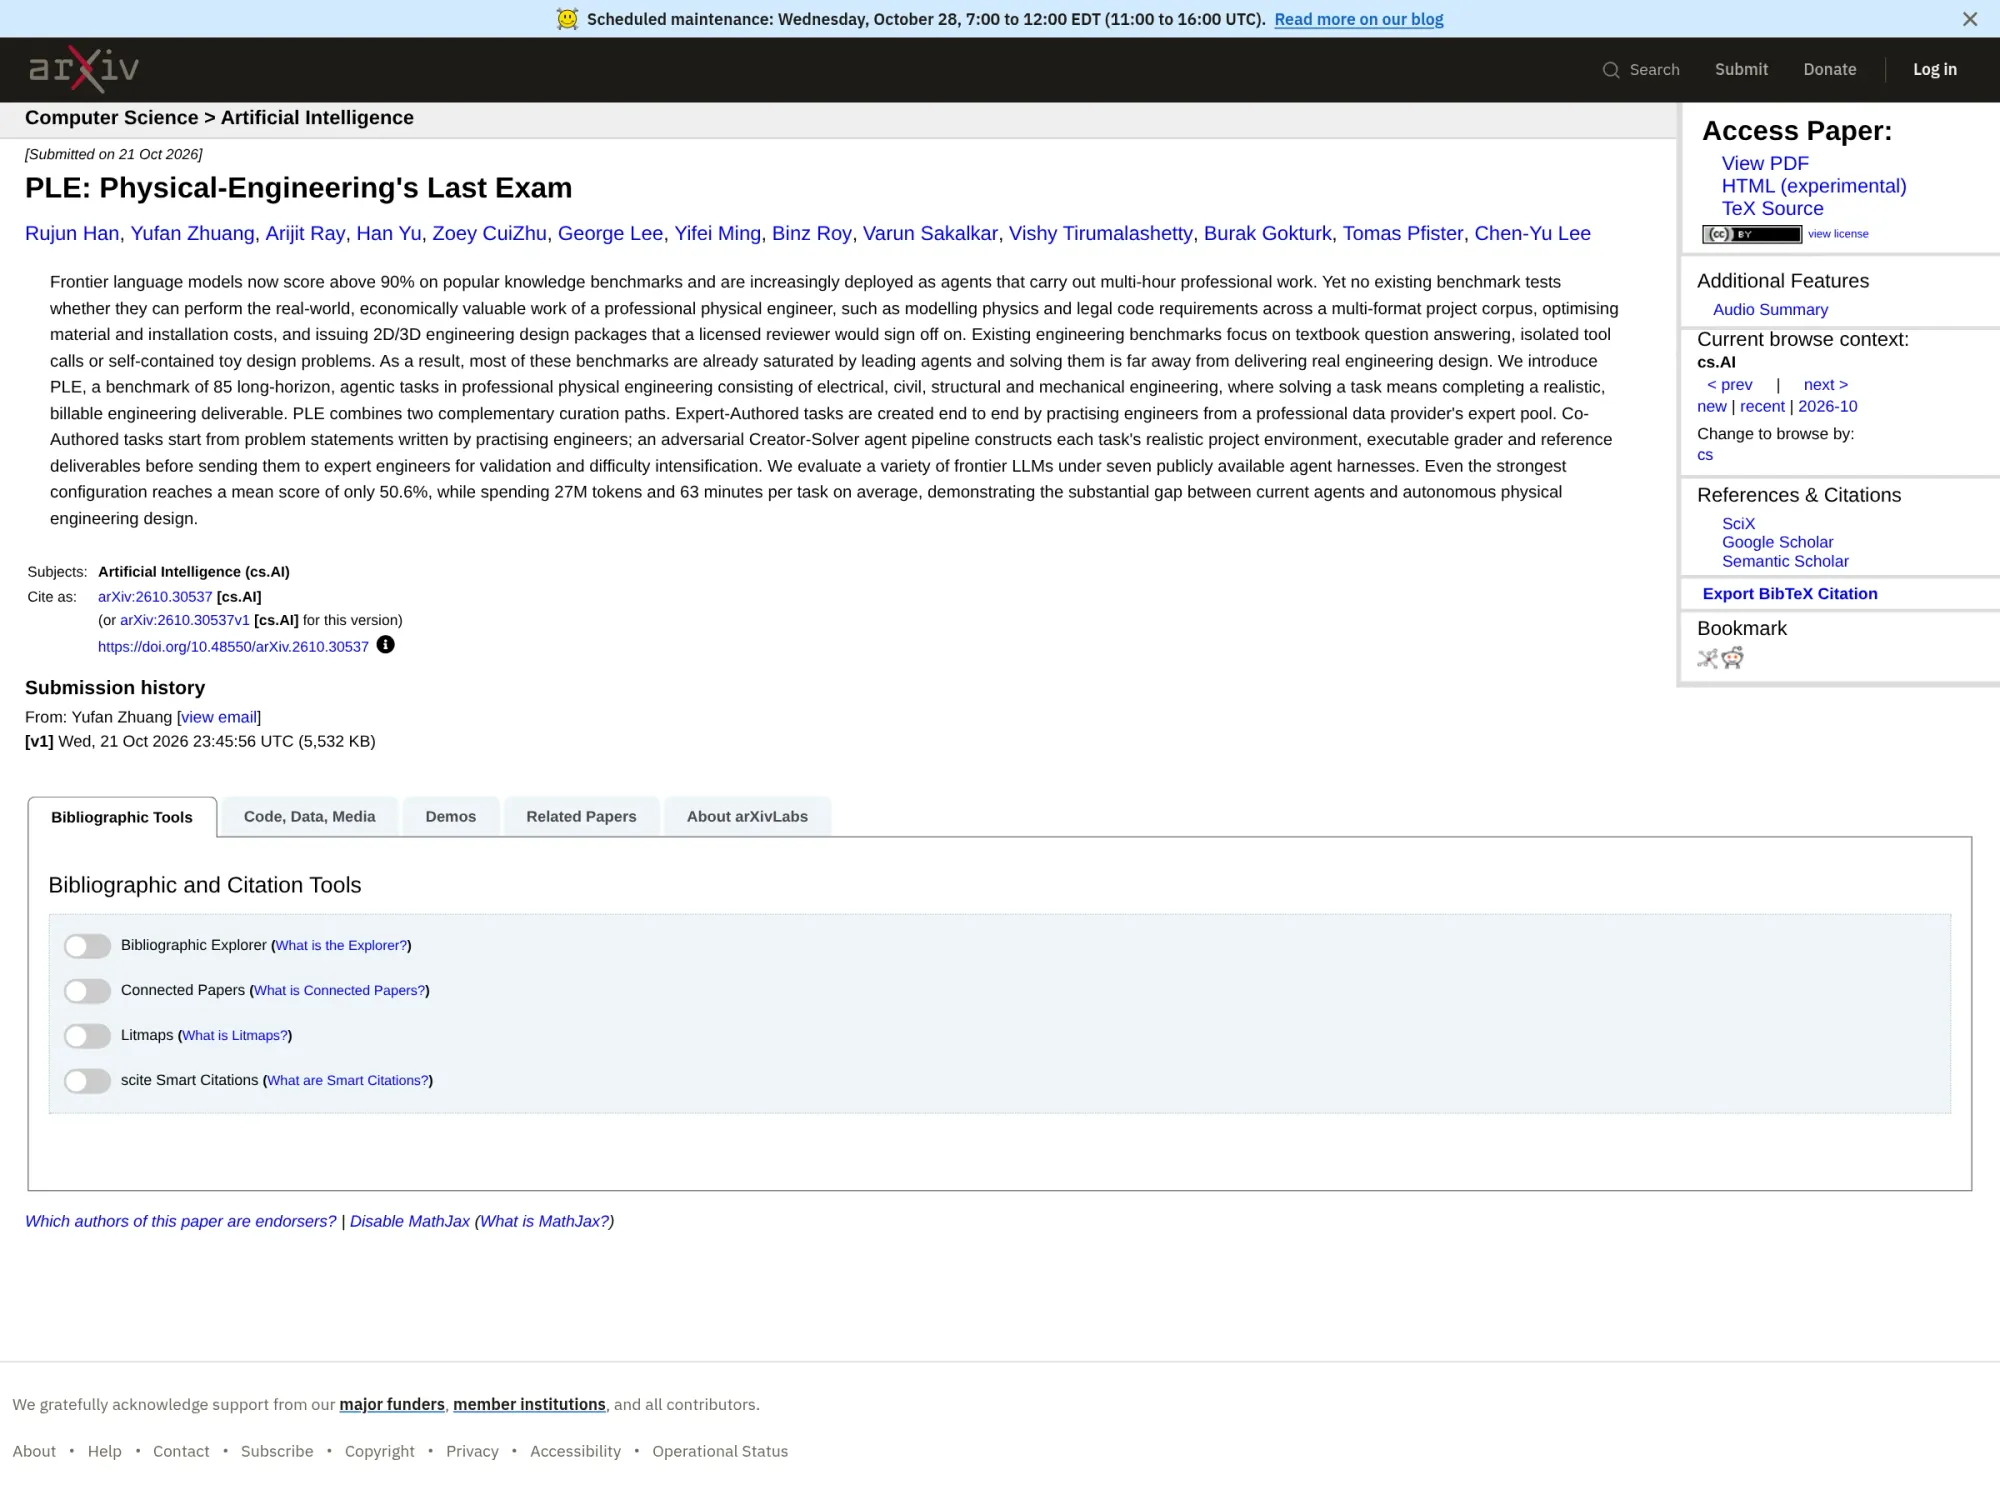
Google Cloud AI Research published PLE, 85 long-horizon engineering tasks graded on the files an agent produces; the best configuration scores 50.6% at $17.18 per task.


TL;DR
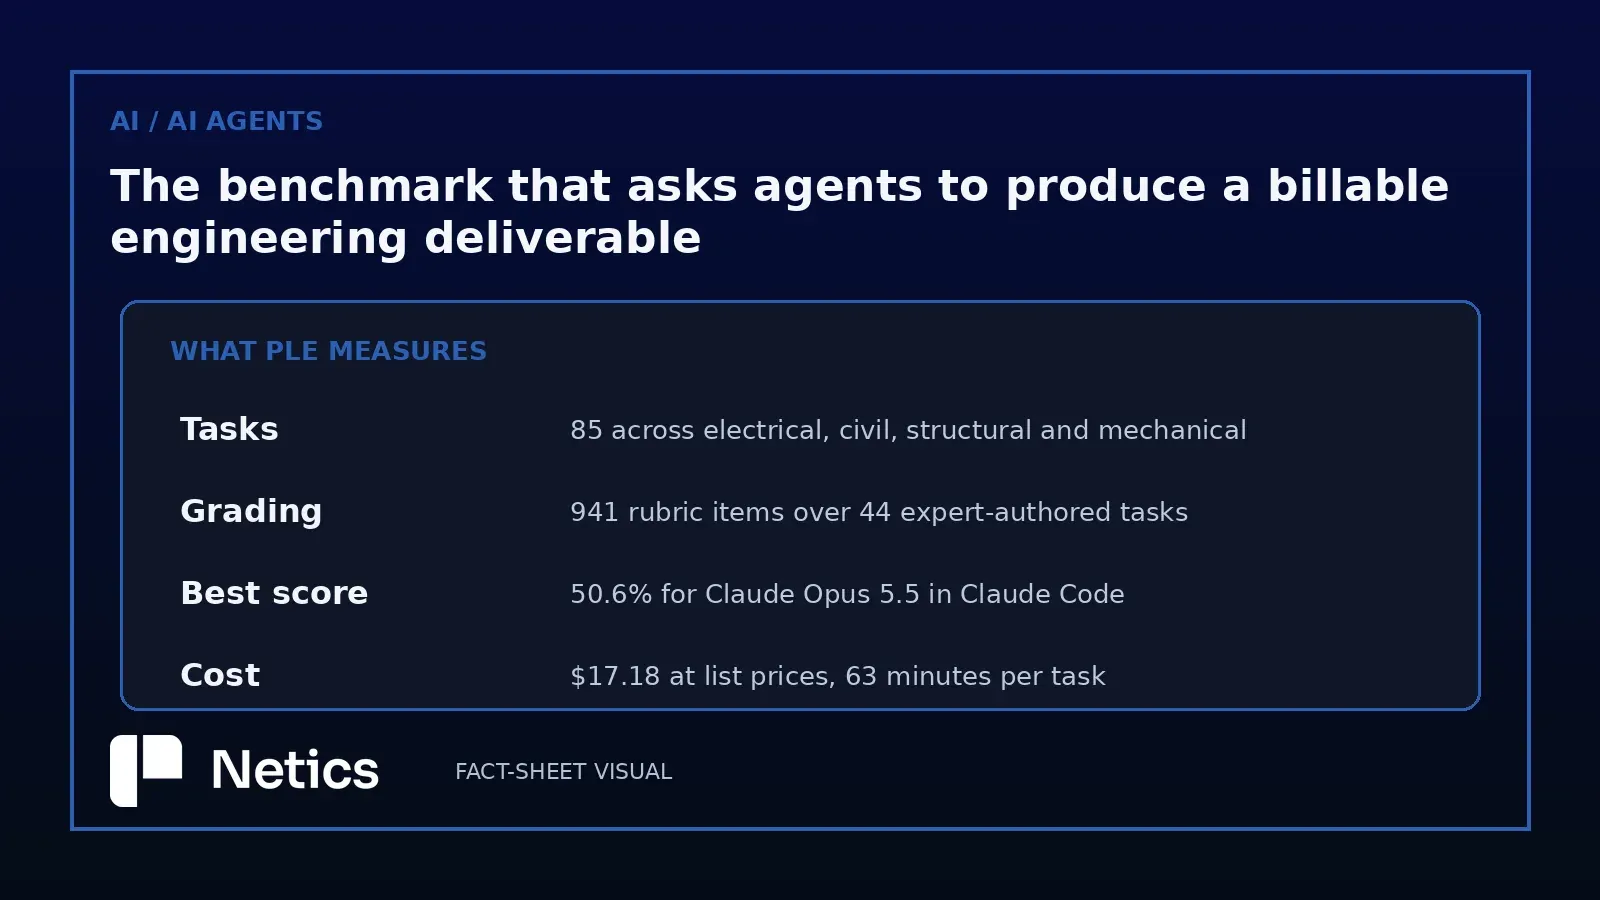
- PLE is a benchmark from Google Cloud AI Research that asks AI agents to do professional physical-engineering work and grades the files they hand back, starting with requests a colleague would send on an active job: a roof deck to size, a site layout to fit, a switchboard to load, a cooling loop to choose.
- It holds 85 long-horizon tasks across structural, civil, electrical and mechanical engineering, built around a realistic project file system of PDFs, spreadsheets, CAD/BIM drawings, correspondence and logs, a file mix an agent has to read before it designs anything.
- PLE has 44 expert-authored tasks with 941 rubric items at 21.4 per task and 41 co-authored tasks; 37 of the co-authored tasks are graded against constraints as well as an objective score.
- The best configuration, Claude Opus 5.5 in Claude Code, reaches a mean score of 50.6% at a cost of $17.18 per task, with 27M tokens and 63 minutes per task on average, and the results on model and harness choice separate very differently: a 50-point spread across models against 0.7 to 12.1 points across harnesses for a fixed model.
- The numbers get soft per task: the mean range of one task-harness cell over three repetitions is 15.4 points, and 105 of the 595 cells span 30 points or more.
- A public subset of 29 tasks ships with its graders and harness; Netics recommends using it as a starting point before adding representative deliverables from the firm's own work.
What PLE asks an agent to produce
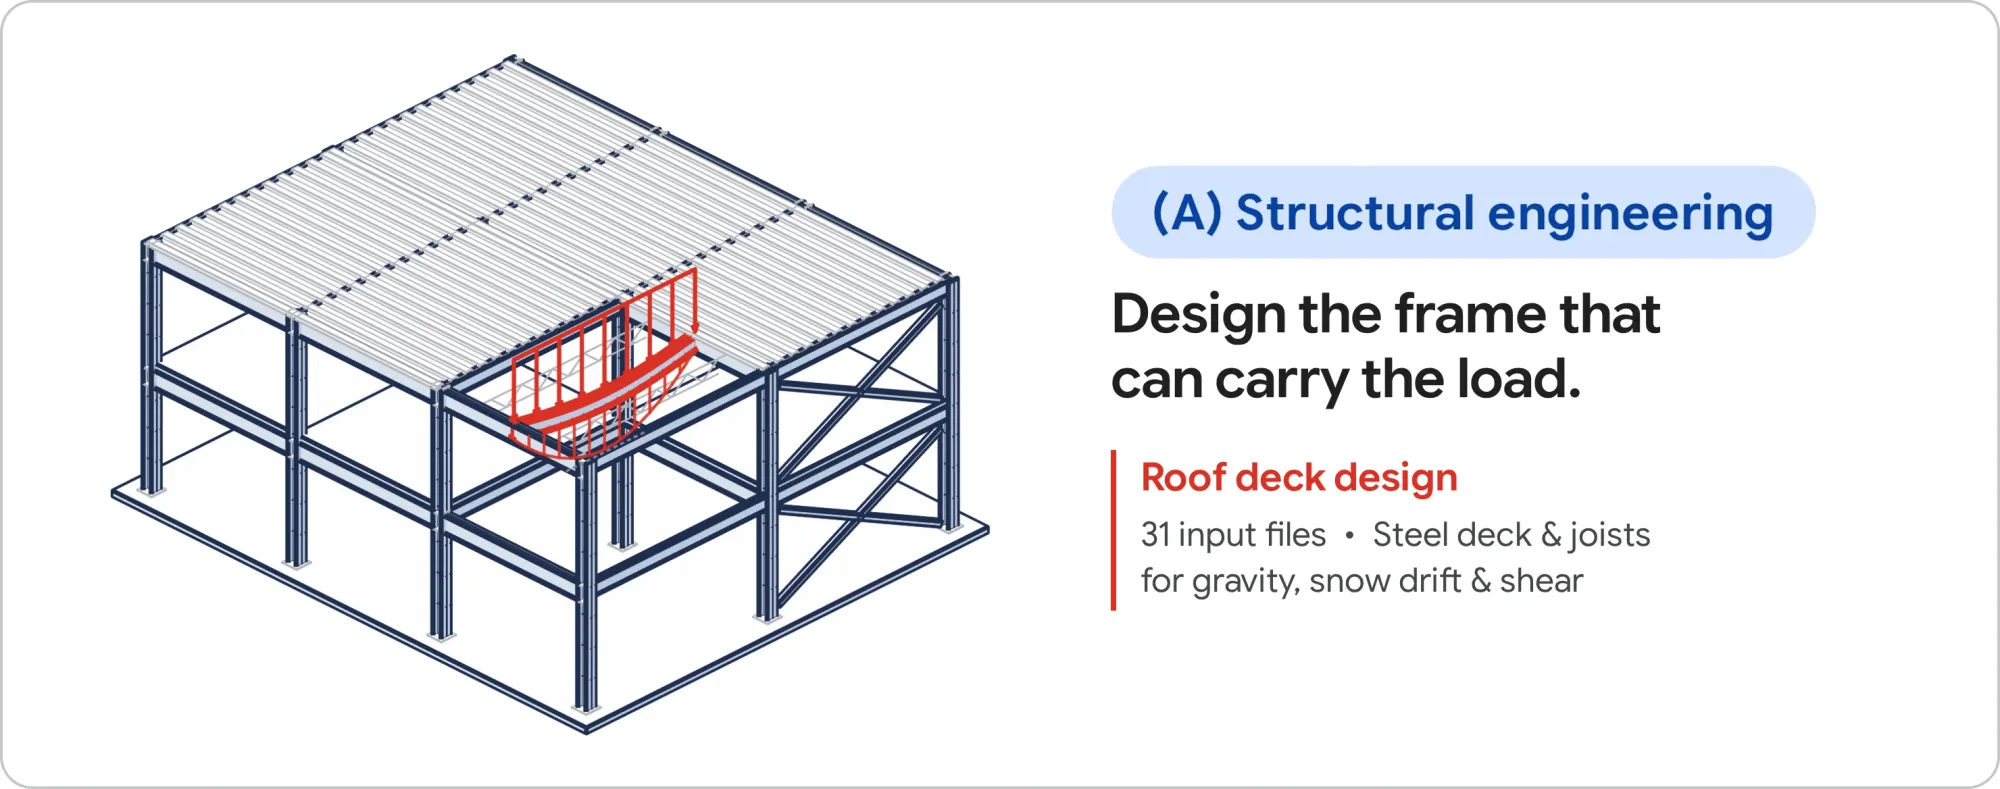
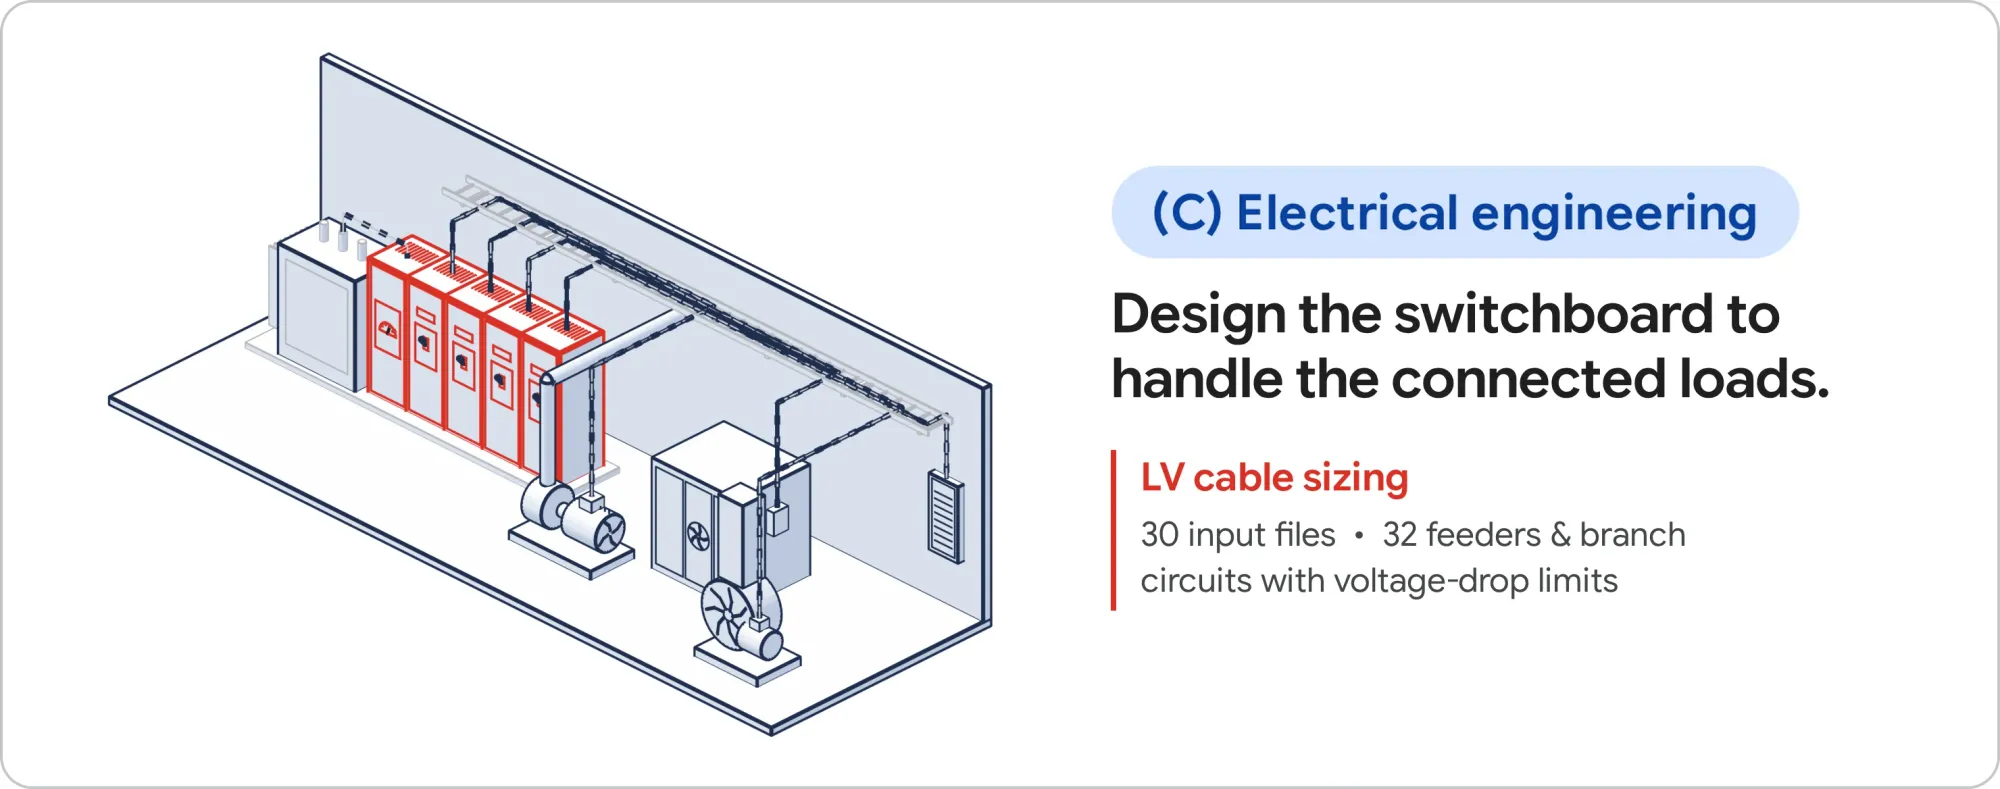
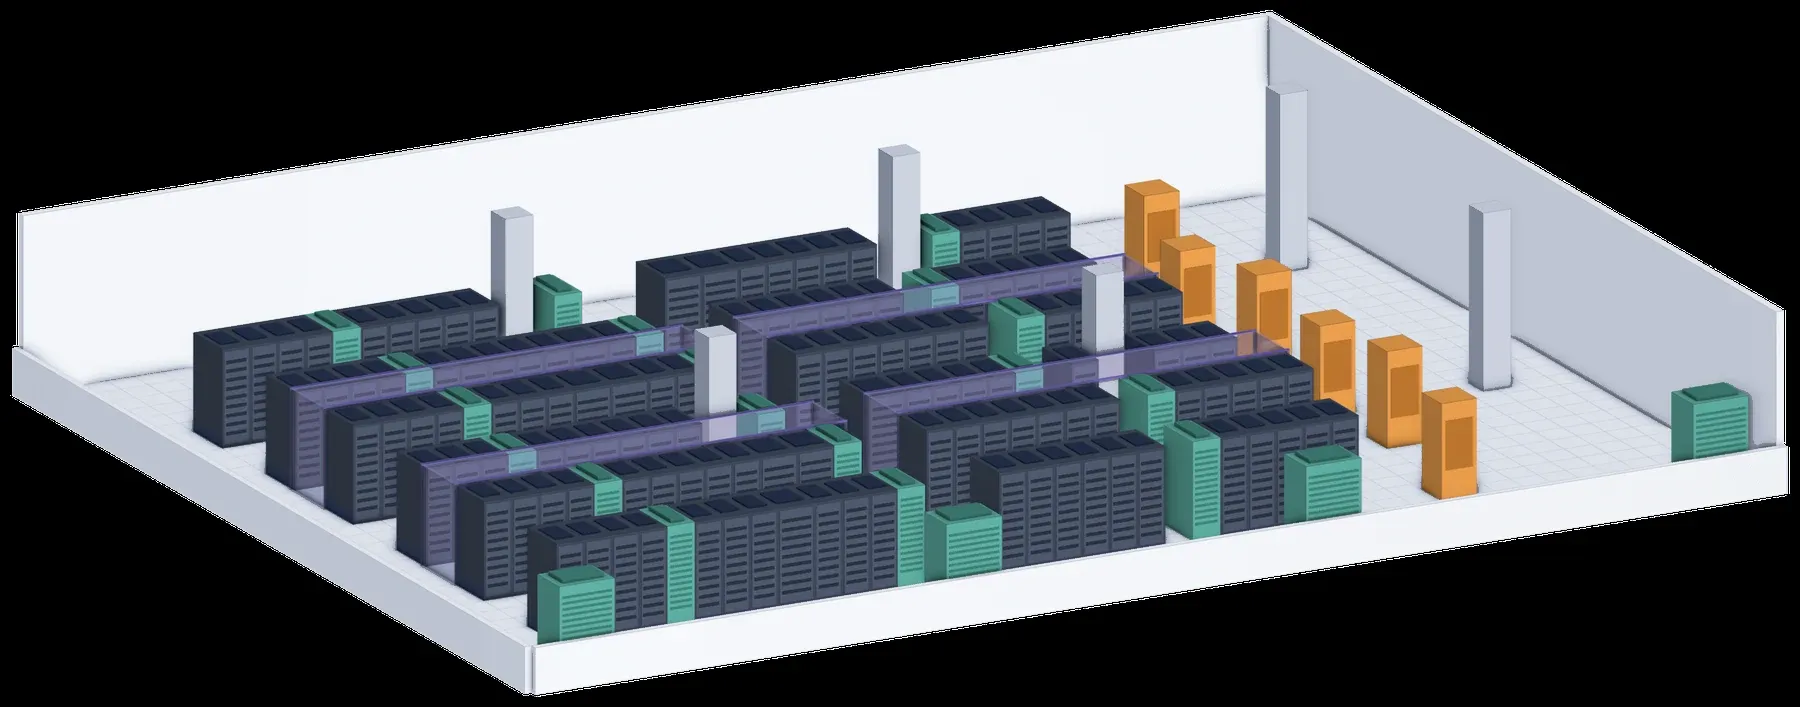
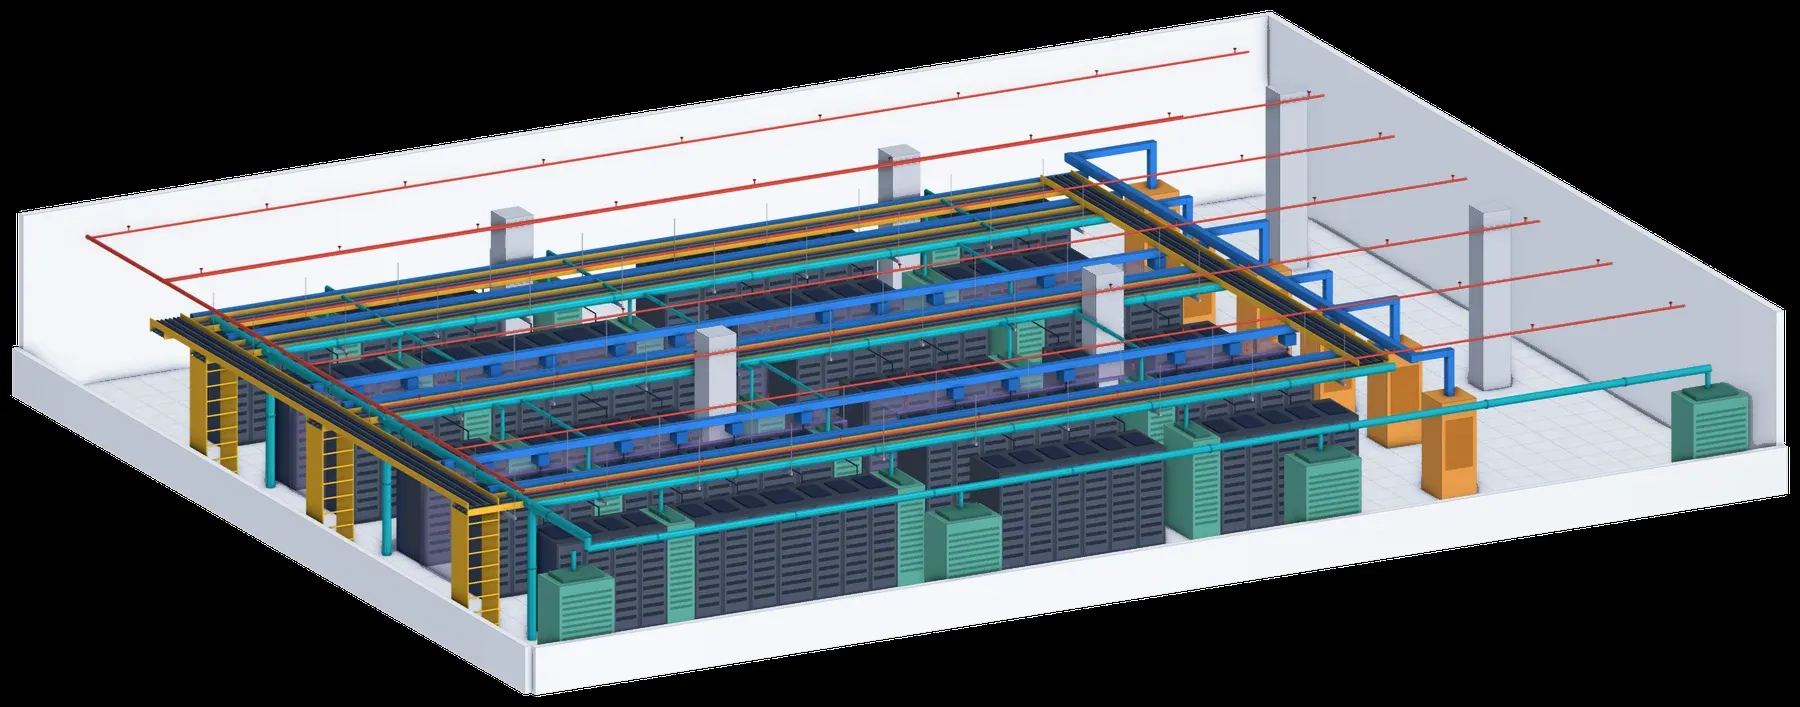
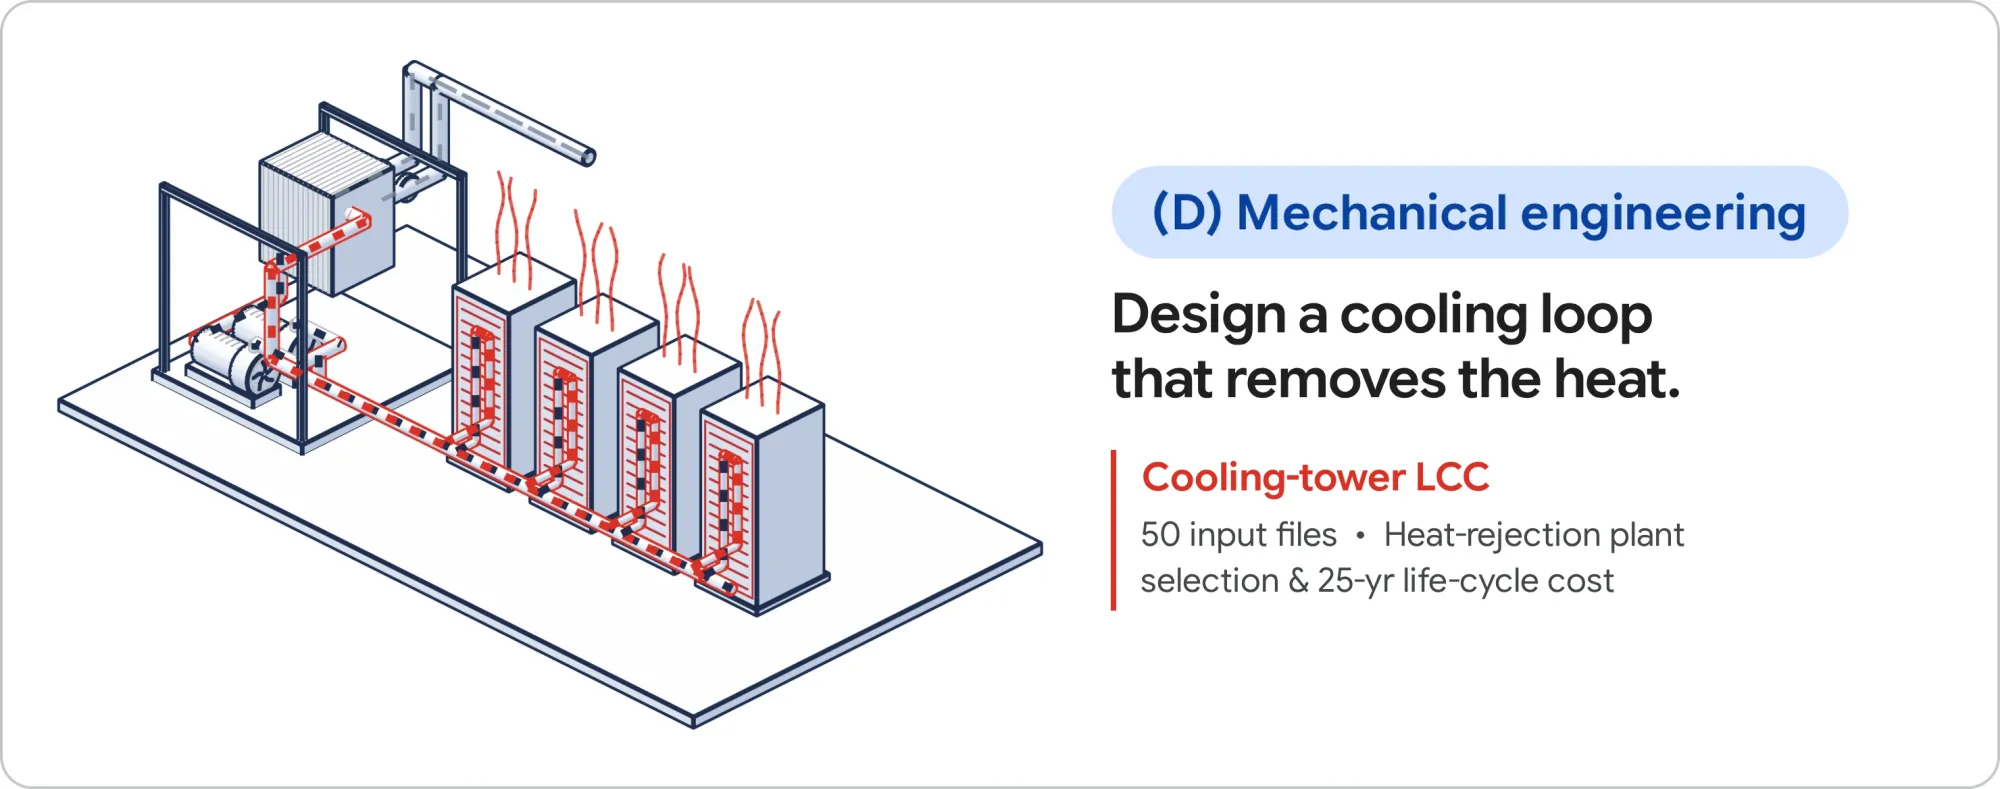
A task opens with a request written the way a client or a senior engineer writes one. The structural example asks for a roof deck design: size the steel decking, the open-web joists and the lateral diaphragm framing so member demand stays inside code capacity under gravity, snow-drift and shear loads. The electrical example asks for a low-voltage switchboard that carries 32 feeders and branch circuits inside ampacity and voltage-drop limits. The mechanical example asks for a cooling loop selected to meet thermal load inside hydraulic limits while keeping the 25-year life-cycle cost down.
Behind that request sits a project file system: PDFs, spreadsheets, CAD and BIM drawings in DXF, DWG and IFC, correspondence and logs. The agent works with document, spreadsheet and code tools, and the answer is a package of files — an engineering memo, a calculation workbook, an equipment schedule, a 2D or 3D drawing. The paper describes these as production-format deliverables that a licensed reviewer would sign off on.
The paper explains why this shape of work is worth measuring and also why it can be graded at all. Existing engineering benchmarks test textbook questions, isolated tool calls or toy design problems whose full specification fits in the prompt, and the paper states that leading agents have already saturated most of them. A signed deliverable behaves differently: it can be checked against the governing documents and against physics, so eligibility and economic quality both become measurable quantities.
How the 85 tasks were built and graded
Two routes produced the tasks. Practising engineers from the data vendor's expert pool wrote 44 of them end to end, inside realistic project environments, and each is graded by a weighted rubric of binary, evidence-bound criteria. Those 44 tasks carry 941 rubric items, 21.4 per task on average.
The Creator-Solver pipeline produced 41 co-authored tasks. Engineers wrote the task briefs, an adversarial agent pipeline built each environment and its grader from licensed engineering documents, and every task was redesigned until a frontier solver agent stopped saturating it, then passed an independent ground-truth audit before experts validated or intensified the difficulty.
Co-authored tasks add a second scoring channel. Alongside rubric constraints, an economic or performance objective is computed from the design itself. The paper gives the reason a rubric alone falls short: two wire schedules that satisfy every code check can differ by more than 20% in installation cost. Binary checks alone cannot distinguish a merely code-compliant design from an economically competitive one.
The file mix an agent has to read
Reproducing the environment also means reproducing its file mix. Across the corpus, 51.6% of files are PDFs, 25.2% are spreadsheets and data tables, and 22.4% are text, Word documents and e-mail. In the co-authored environments the balance shifts to 31.2% PDFs and 27.5% spreadsheets and data. The grader checks the requirements listed by the agent against the references, so successful navigation of the corpus contributes to the final score.
What the results say about model and harness choice
Fourteen frontier models ran under seven publicly available agent harnesses, three runs per pair. Claude Opus 5.5 in Claude Code leads at 50.6%, GPT 6 Astra in Codex reaches 48.3%, Gemini 4 Argon in Antigravity 41.7%, Claude Fable 5 in Claude Code 34.9% and Grok 4.7 in Grok Build 32.0%. Gemini 3.8 Flash in Antigravity lands at 26.4%, while Qwen3 Coder 480B, MiniMax M2 and Llama 4 Maverick stay below 7% on their best harness, with Llama 4 Maverick in Claude Code at 0.4%.
Read as a model ranking, that table hides the more useful comparison. Taking each model's best harness, the spread across models reaches roughly 50 points. For a fixed model, the spread across the seven harnesses runs from 0.7 to 12.1 points with a median of 3.0, and for Claude Opus 5.5 the harnesses span 47.3% to 50.6%. Model choice dominates, and harness choice still moves the result enough to matter between two engines of similar capability.
What the results cost per task
Cost moves on its own track. The median configuration in the paper costs $6.63 per task and scores 25.7%, while the leader costs $17.18. A pair that scores a few points below the leader at a fraction of that price is the interesting option for anyone planning volume.
Where the numbers get soft
Run-to-run variance is large at the level of a single task. The mean range of a task-harness cell over three runs is 15.4 points, and 105 of the 595 cells span 30 points or more. Set-level means are far steadier: for Claude Opus 5.5 each harness mean has a standard deviation of 0.3 to 1.8 points across its three runs, with Claude Code at 52.0%, 49.3% and 50.6%.
The grading was re-checked in the same section. All 1,159 LLM-judged runs of Claude Opus 5.5 across the seven harnesses were re-graded with a second pass of Claude Opus 5.5, plus Claude Opus 5 and Gemini 4 Argon, and the second Claude Opus 5.5 pass reproduces 98.7% of item verdicts.
Anyone quoting a single screenshot of an agent's score is quoting noise. The paper's own instruction is that reported per-task numbers belong with repeated runs, and a procurement conversation about agent capacity should ask for the number of runs before it asks for the percentage.
What an engineering team can do with a public 29-task subset
The paper releases a public set of 29 of the 85 tasks together with their graders and the agent harness, and holds the remaining tasks private for an open competition and leaderboard. Netics recommends taking that public subset as a starting point, then defining separate checks for the firm's own deliverable conventions.
Netics recommends running the public subset first, then putting three of the firm's most common deliverable types through the same harness and recording scores and observed failure modes. The review record should flag any rounding errors, code-edition mismatches and omitted load cases alongside the mean score.
The harness question is the one that survives the benchmark. An agent platform that a team runs itself has to answer the same question PLE asks: what surrounds the model, and how much of the result comes from that. For related context, the article on benchmarking an inference stack with a real load client discusses load generators and measurement design.
Sources
Source: PLE: Physical-Engineering's Last Exam — arXiv, submitted 2026-10-21 — https://arxiv.org/abs/2610.30537, retrieved 2026-10-24 (authors Rujun Han, Yufan Zhuang, Arijit Ray, Han Yu, Zoey CuiZhu, George Lee, Yifei Ming, Binz Roy, Varun Sakalkar, Vishu Tirumalashetty, Burak Gokturk, Tomas Pfister and Chen-Yu Lee, all affiliated with Google Cloud AI Research; 85 tasks across electrical, civil, structural and mechanical engineering; seven publicly available agent harnesses; best configuration at a 50.6% mean score spending 27M tokens and 63 minutes per task; public release of 29 of the 85 tasks with graders and harness; code at github.com/google-research/ple; project page ple-bench.com).
Source: PLE paper full text and figures — arXiv HTML rendering — https://arxiv.org/html/2610.30537v1, retrieved 2026-10-24 (44 expert-authored tasks carrying 941 rubric items at 21.4 per task; 41 co-authored tasks, including 37 constraint-graded tasks among the 81 tasks graded by rubric items or constraints; 14 frontier models, Claude Opus 5.5 in Claude Code at 50.6% at $17.18 per task, GPT 6 Astra in Codex 48.3%, Gemini 4 Argon in Antigravity 41.7%, Claude Fable 5 34.9%, Grok 4.7 in Grok Build 32.0%, Gemini 3.8 Flash 26.4%; median cost $6.63 and median score 25.7%; a 50-point spread across models against a 0.7 to 12.1 point spread across harnesses at a median of 3.0; Claude Opus 5.5 harnesses from 47.3% to 50.6%; per-cell mean range 15.4 points with 105 of 595 cells above 30 points; harness means with a standard deviation of 0.3 to 1.8 points and Claude Code at 52.0%, 49.3% and 50.6%; 1,159 LLM-judged runs re-graded with 98.7% of item verdicts reproduced; corpus at 51.6% PDFs, 25.2% spreadsheets and data tables and 22.4% text, Word documents and e-mail, with co-authored environments at 31.2% PDFs and 27.5% spreadsheets and data; figures 1A, 1C, 1D and the 3D task figures reproduced above).
Source: PLE: Physical-Engineering's Last Exam — Google Cloud AI Research, arXiv 2610.30537, submitted 21 October 2026, retrieved 2026-10-24. Figures reproduced from the paper's HTML rendering on arXiv; the two fact-sheet visuals are Netics editorial diagrams built from the paper's published numbers.