
Benchmarking LLM Inference Needs a Real Load Client
NVIDIA's AIPerf replaces GenAI-Perf with a multiprocess load client that stops being the bottleneck. Netics on why LLM inference numbers are only worth as much as the client generating them.

TL;DR
- NVIDIA shipped AIPerf, the designated successor to GenAI-Perf, on the Developer Blog (September 18, 2026).
- It is a multiprocess load client — workers generate traffic, record-processors handle results, coordinated over ZMQ — so the client stops being the bottleneck.
- 15+ endpoint types, ShareGPT and trace replay (Mooncake, Baseten, WEKA AgentX), and constant/Poisson/gamma arrival patterns with reproducibility flags.
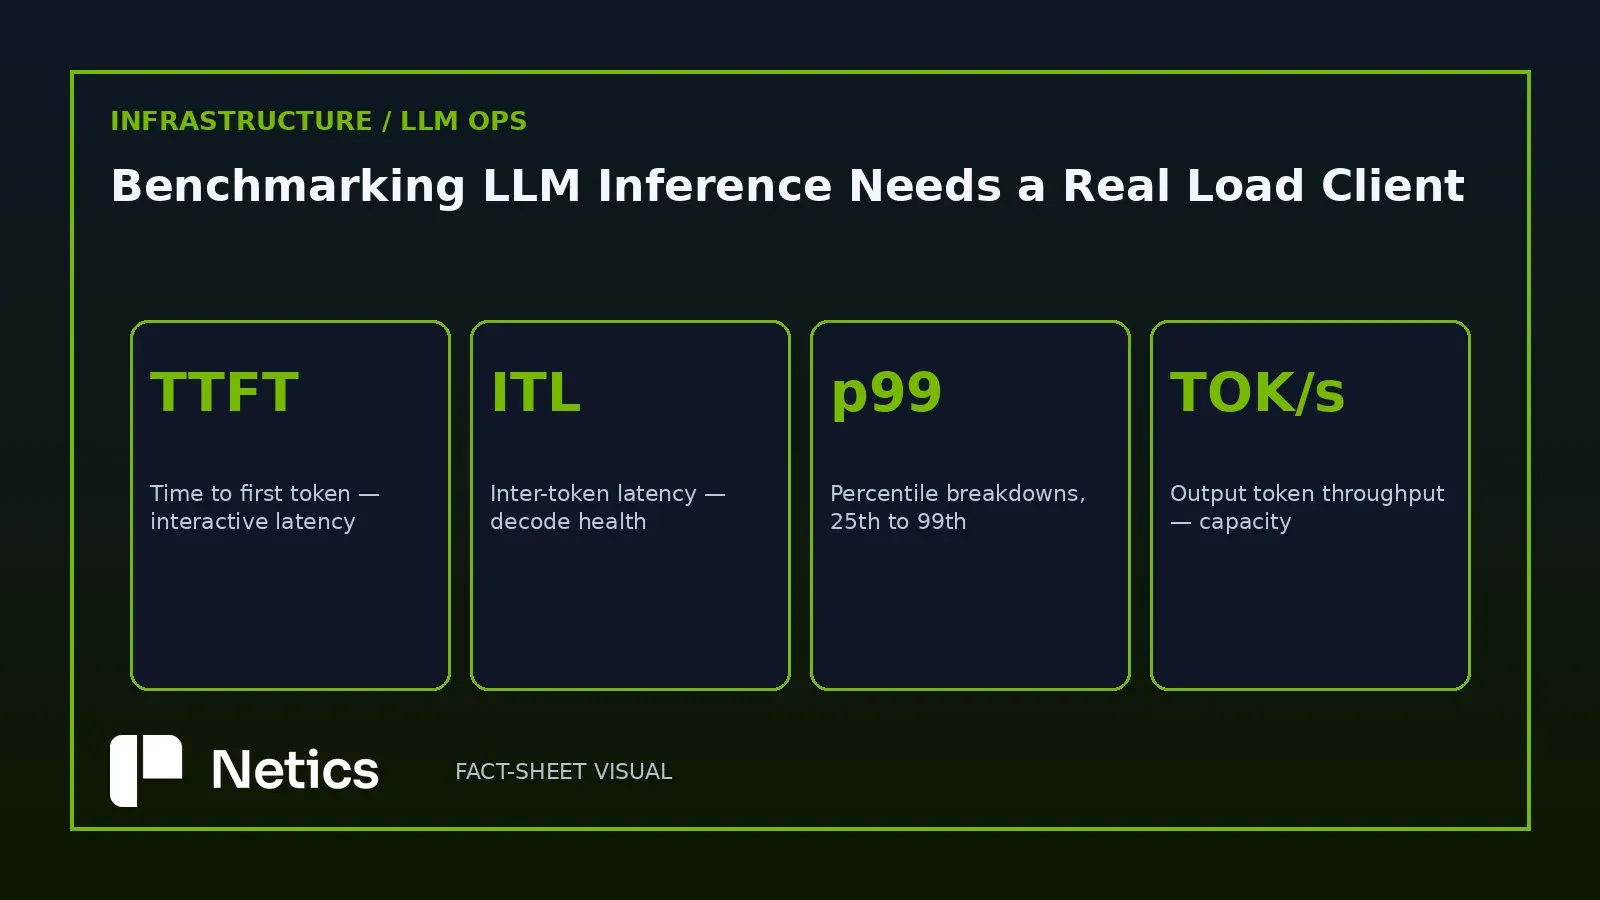
- Core metrics: TTFT, ITL, request latency, output token throughput, with p25-p99 breakdowns and optional GPU telemetry.
- Netics' take: the tool change is real, but the discipline is the same — percentile reading, load shaping, and honest client capacity are what make inference numbers trustworthy.
The client was the silent variable
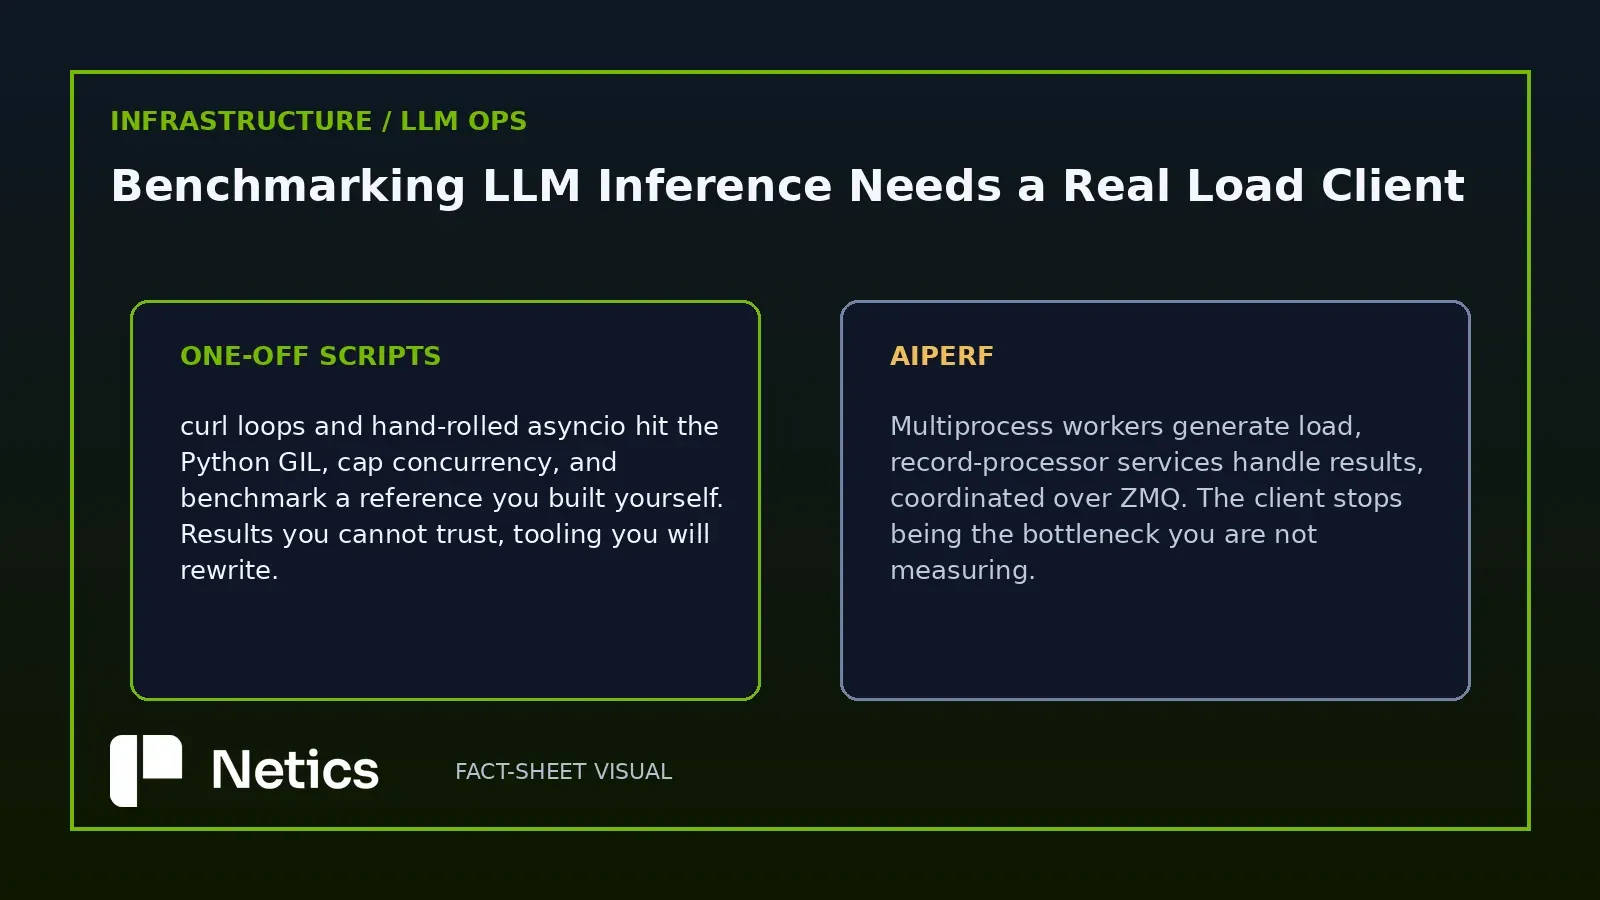
Every LLM inference benchmark you have ever quoted has a hidden actor: the load client. If the client is a single-process script — curl loops, a hand-rolled asyncio harness, or GenAI-Perf itself on top of Perf Analyzer — Python's GIL caps concurrency, and the numbers you get describe the client's ceiling as much as the server's. NVIDIA's answer is a ground-up rewrite: AIPerf splits load generation (worker processes) from result handling (record-processor services) and coordinates them over ZMQ, so a single benchmark client can saturate a real server without becoming the bottleneck itself.
That is the architectural difference that matters. GenAI-Perf ran on top of Perf Analyzer, which made it a wrapper around an older stack; AIPerf is a clean break, and the migration guide exists precisely because present workflows need porting. For anyone who has fought a benchmark where raising concurrency changed nothing because the client saturated first, this is the fix in the right layer.
Percentiles are the skill, not the tool
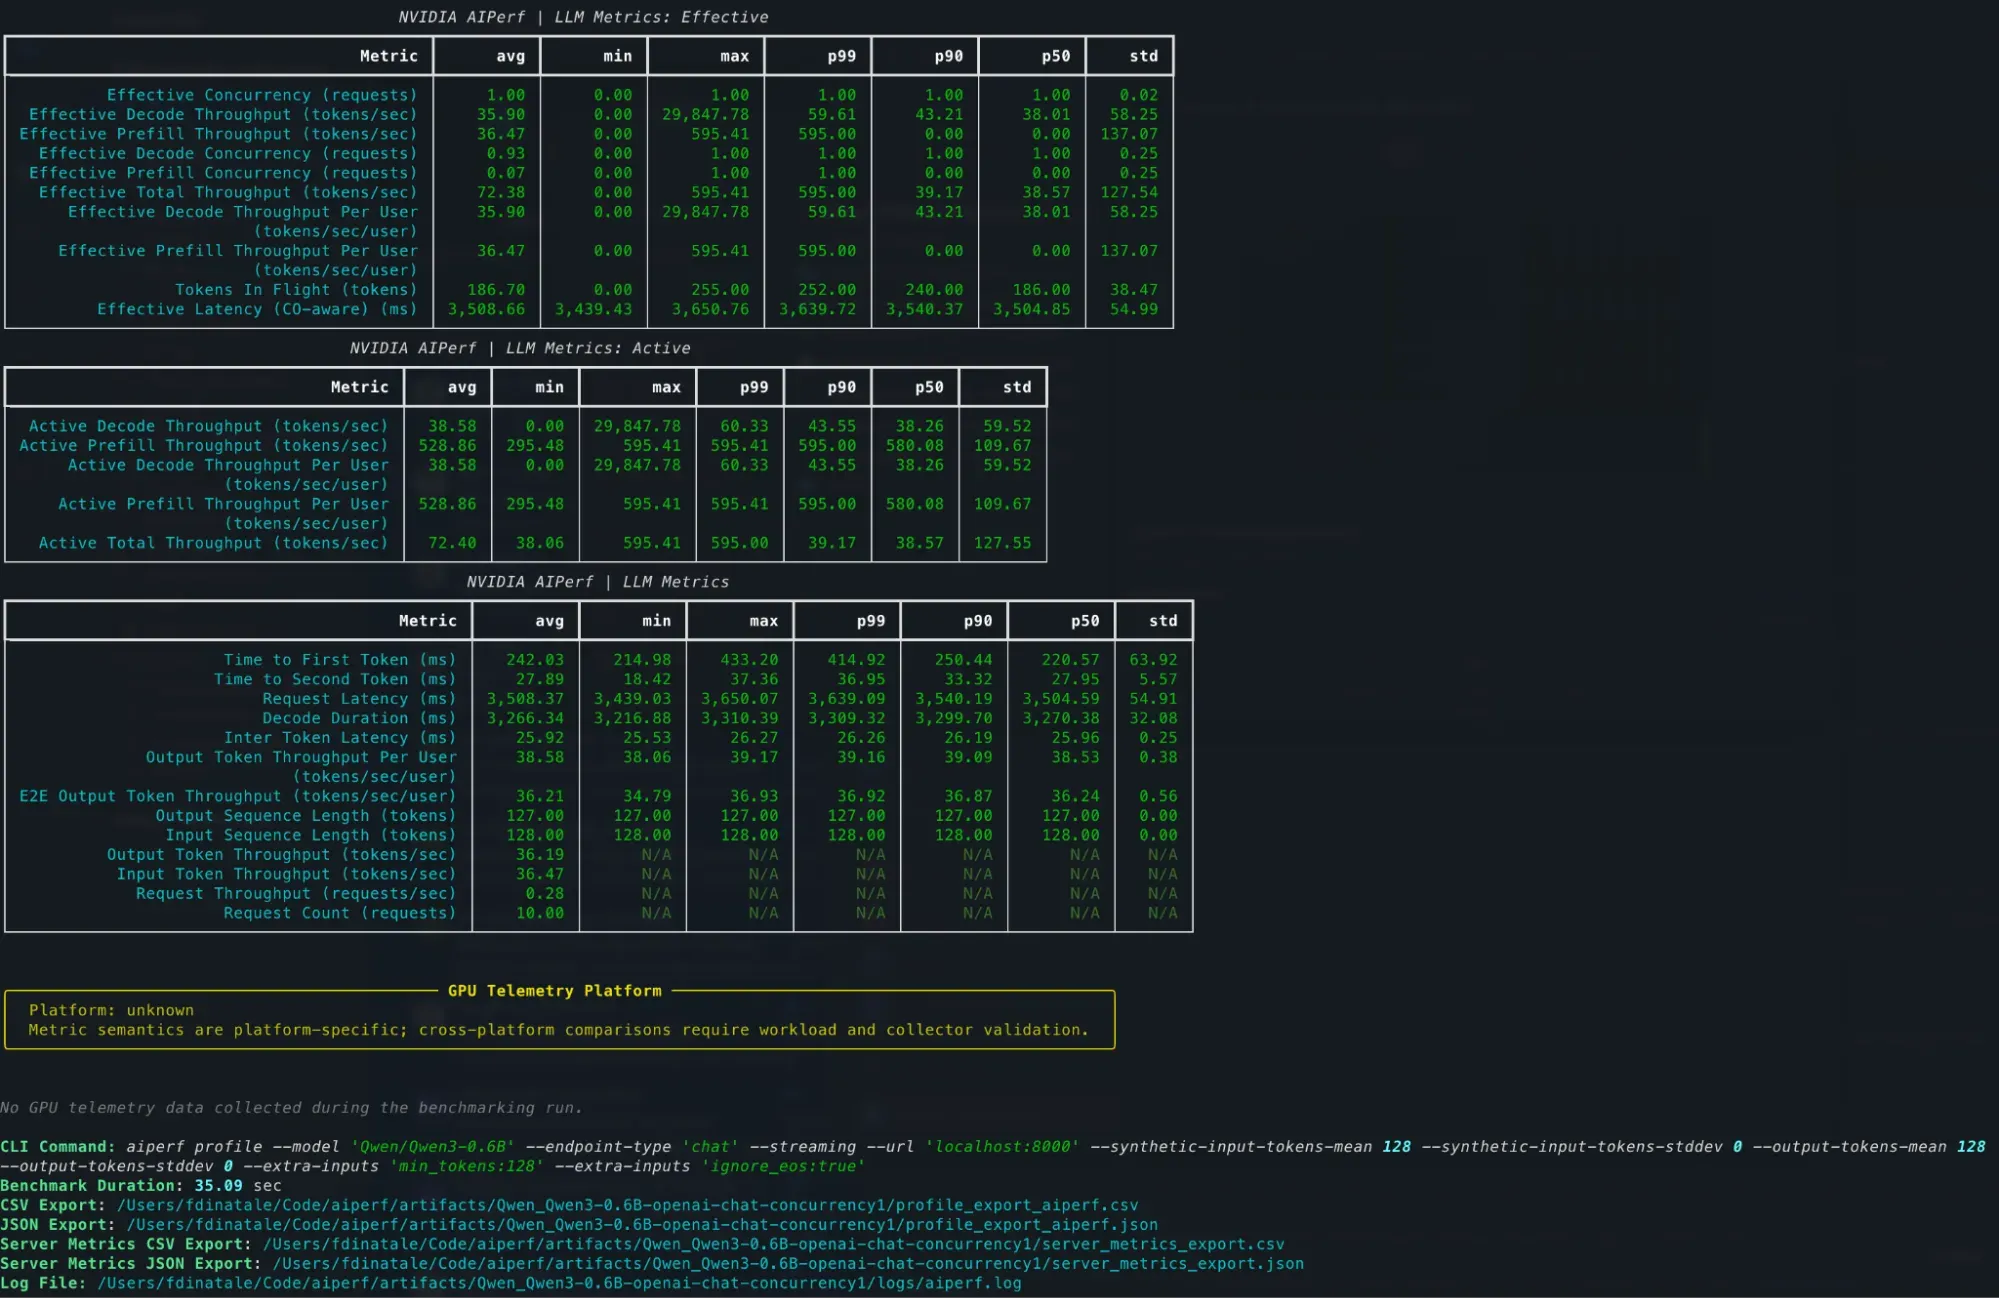
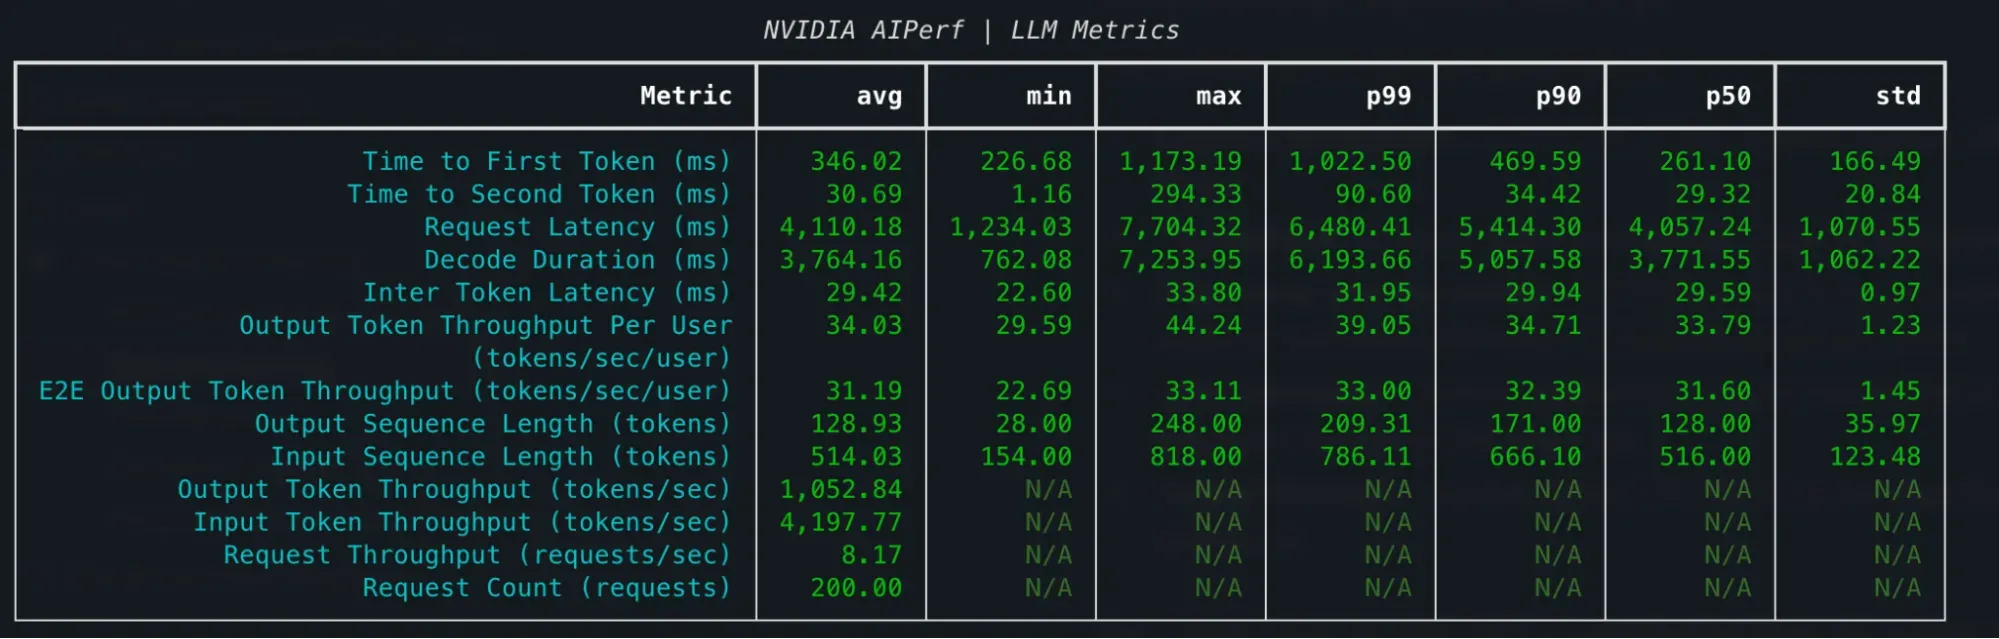
AIPerf reports the core four — TTFT (time to first token), ITL (inter-token latency), request latency, and output token throughput — in percentile breakdowns from p25 to p99 with min/max/average and standard deviation. The percentile work is where the real engineering lives: a server with a healthy mean TTFT and an outlier p99 looks fine in aggregate and fails in production. AIPerf's load-shaping knobs feed those percentiles honestly — constant, Poisson, and gamma arrival patterns with tunable burstiness, gradual ramping for concurrency and request rate, and synthetic distributions for variable input/output sequence lengths.
Three flags deserve special attention because they are reproducibility, not decoration. --streaming is required to measure TTFT and ITL at all: without it the server batches the full response, and there are no first-token or decode-token events. min_tokens and ignore_eos pin the output length; without them the model stops whenever it naturally finishes, output counts drift, and your throughput numbers are not reproducible across runs. --random-seed 42 makes the Poisson timing and synthetic length draws reproducible, so the same command produces the same request sequence — the difference between a headline number and a test you can re-run after a config change.
Replaying real traffic beats inventing your own
The quiet capability is trace replay. AIPerf supports public datasets like ShareGPT and replay formats from Mooncake, Baseten and WEKA AgentX, which means you can feed a server the shape of traffic it will actually see rather than a synthetic average. Combined with the arrival-pattern controls, that turns a benchmark from a lab exercise into a capacity-planning input: a database vendor's p50 chart tells you nothing about your users' request-rate jitter, but a Poisson run at your expected concurrency tells you the p99 your SREs will actually feel.
GPU telemetry lands in the same run output when DCGM or pynvml is available — power draw, utilization, memory. Correlating a latency spike with a memory-pressure event no longer requires a separate profiling session. For the infrastructure teams this blog serves, that is the difference between a vague complaint about a slow LLM stack and a specific diagnosis: the decode phase is memory-bound at 90% utilization.
What this changes for an inference rollout
Start by re-running your existing GenAI-Perf scenarios under AIPerf with --streaming and pinned output lengths; the migration guide covers the flag deltas, and the comparison will show where the old client was the limit. Second, adopt one real load shape — Poisson at your expected request rate — and record p50, p90, p99 instead of the mean; that is the number that survives contact with production. Third, if your traffic has recognizable patterns (bursty batches, long-context users), replay a captured trace rather than a synthetic distribution and keep the repeat command line AIPerf prints as your regression test. The tool replaced GenAI-Perf, but the underlying habit — verifying that the measurement client is not part of the bottleneck — is the perimeter to keep.
The broader point connects to everything Netics argues about AI infrastructure: routing decides where inference runs, and benchmarking decides whether you can trust the result after routing. A load client you can saturate-and-trust is the missing third leg for teams buying GPUs on vendor benchmarks or capacity-planning their own vLLM fleets. That, more than the tool swap, is the reason to read the migration guide this quarter. If you want a practical pass over your inference measurement setup, the Netics homepage is where we start.
Sources
- Benchmarking LLM Inference at Scale with AIPerf — NVIDIA Technical Blog, September 18, 2026.
- AIPerf — ai-dynamo on GitHub, accessed September 22, 2026.
Source: "Benchmarking LLM Inference at Scale with AIPerf" — developer.nvidia.com, September 18, 2026.