
The Rack Is Now a Power Contract: Density Numbers Decide Where Compute Lands
Rack density moved from about 16 kW to 27 kW in a single year, and the newest AI racks are specified up to 246 kW. That makes the electricity room, the fluid loop and the grid queue the deci

TL;DR
- Rack power density is the electrical load that a single equipment rack in a data centre draws, measured in kilowatts per rack. It is the figure that sets how much compute a floor can carry, and it is planned together with the cooling that removes the heat.
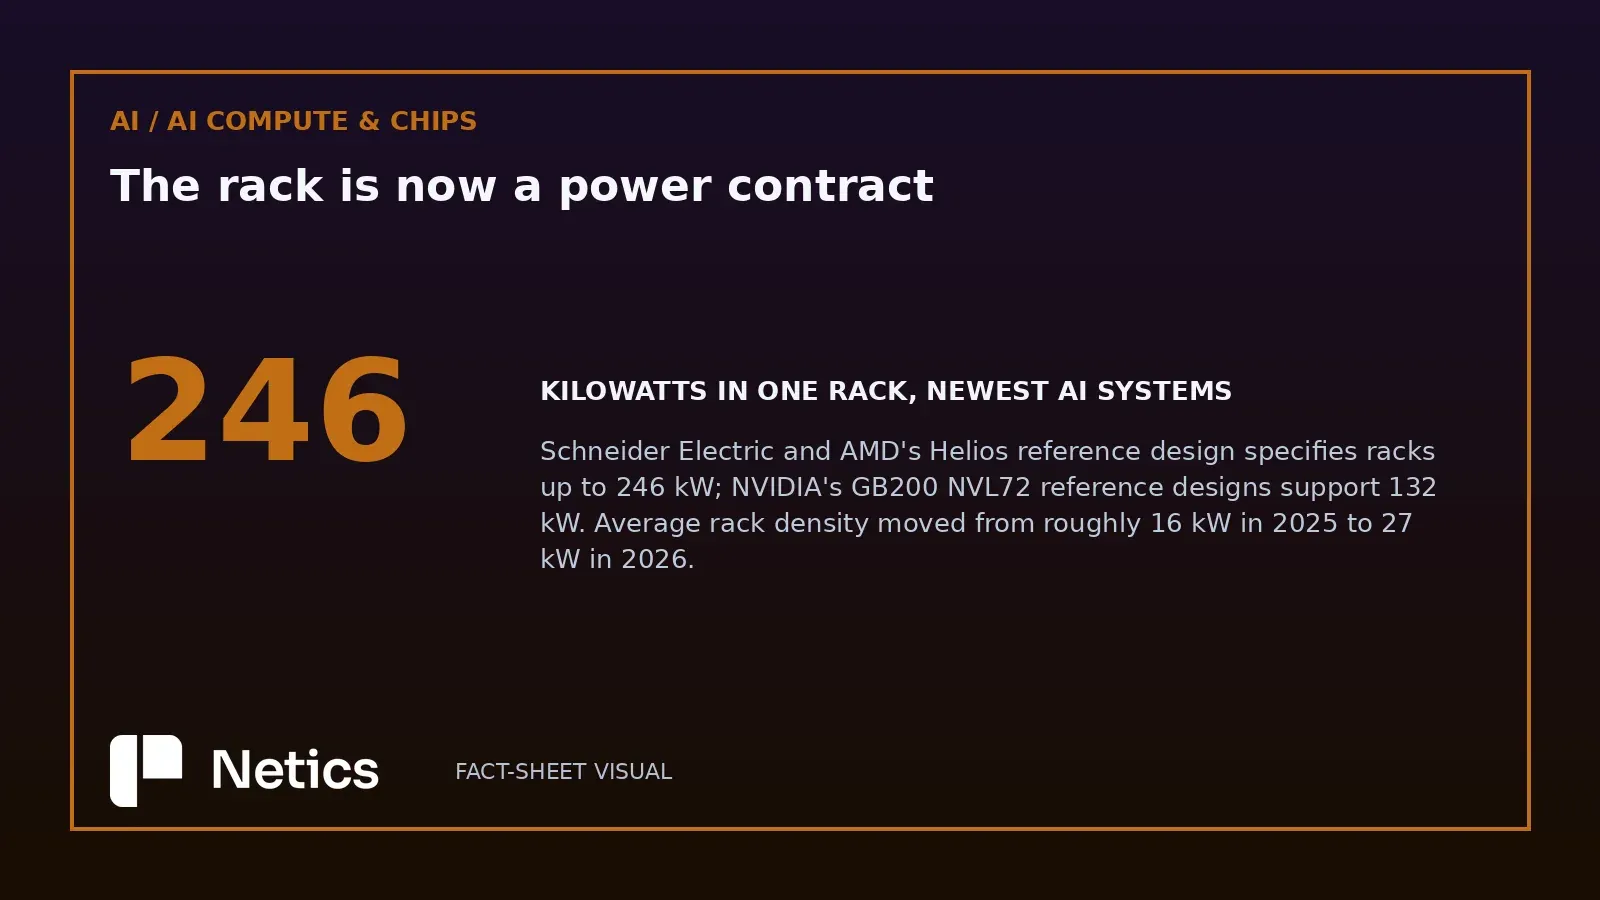
- Average rack density moved from roughly 16 kW in 2025 to 27 kW in 2026, and the newest AI systems are specified up to 246 kW per rack. A single rack now draws what a small server room used to.
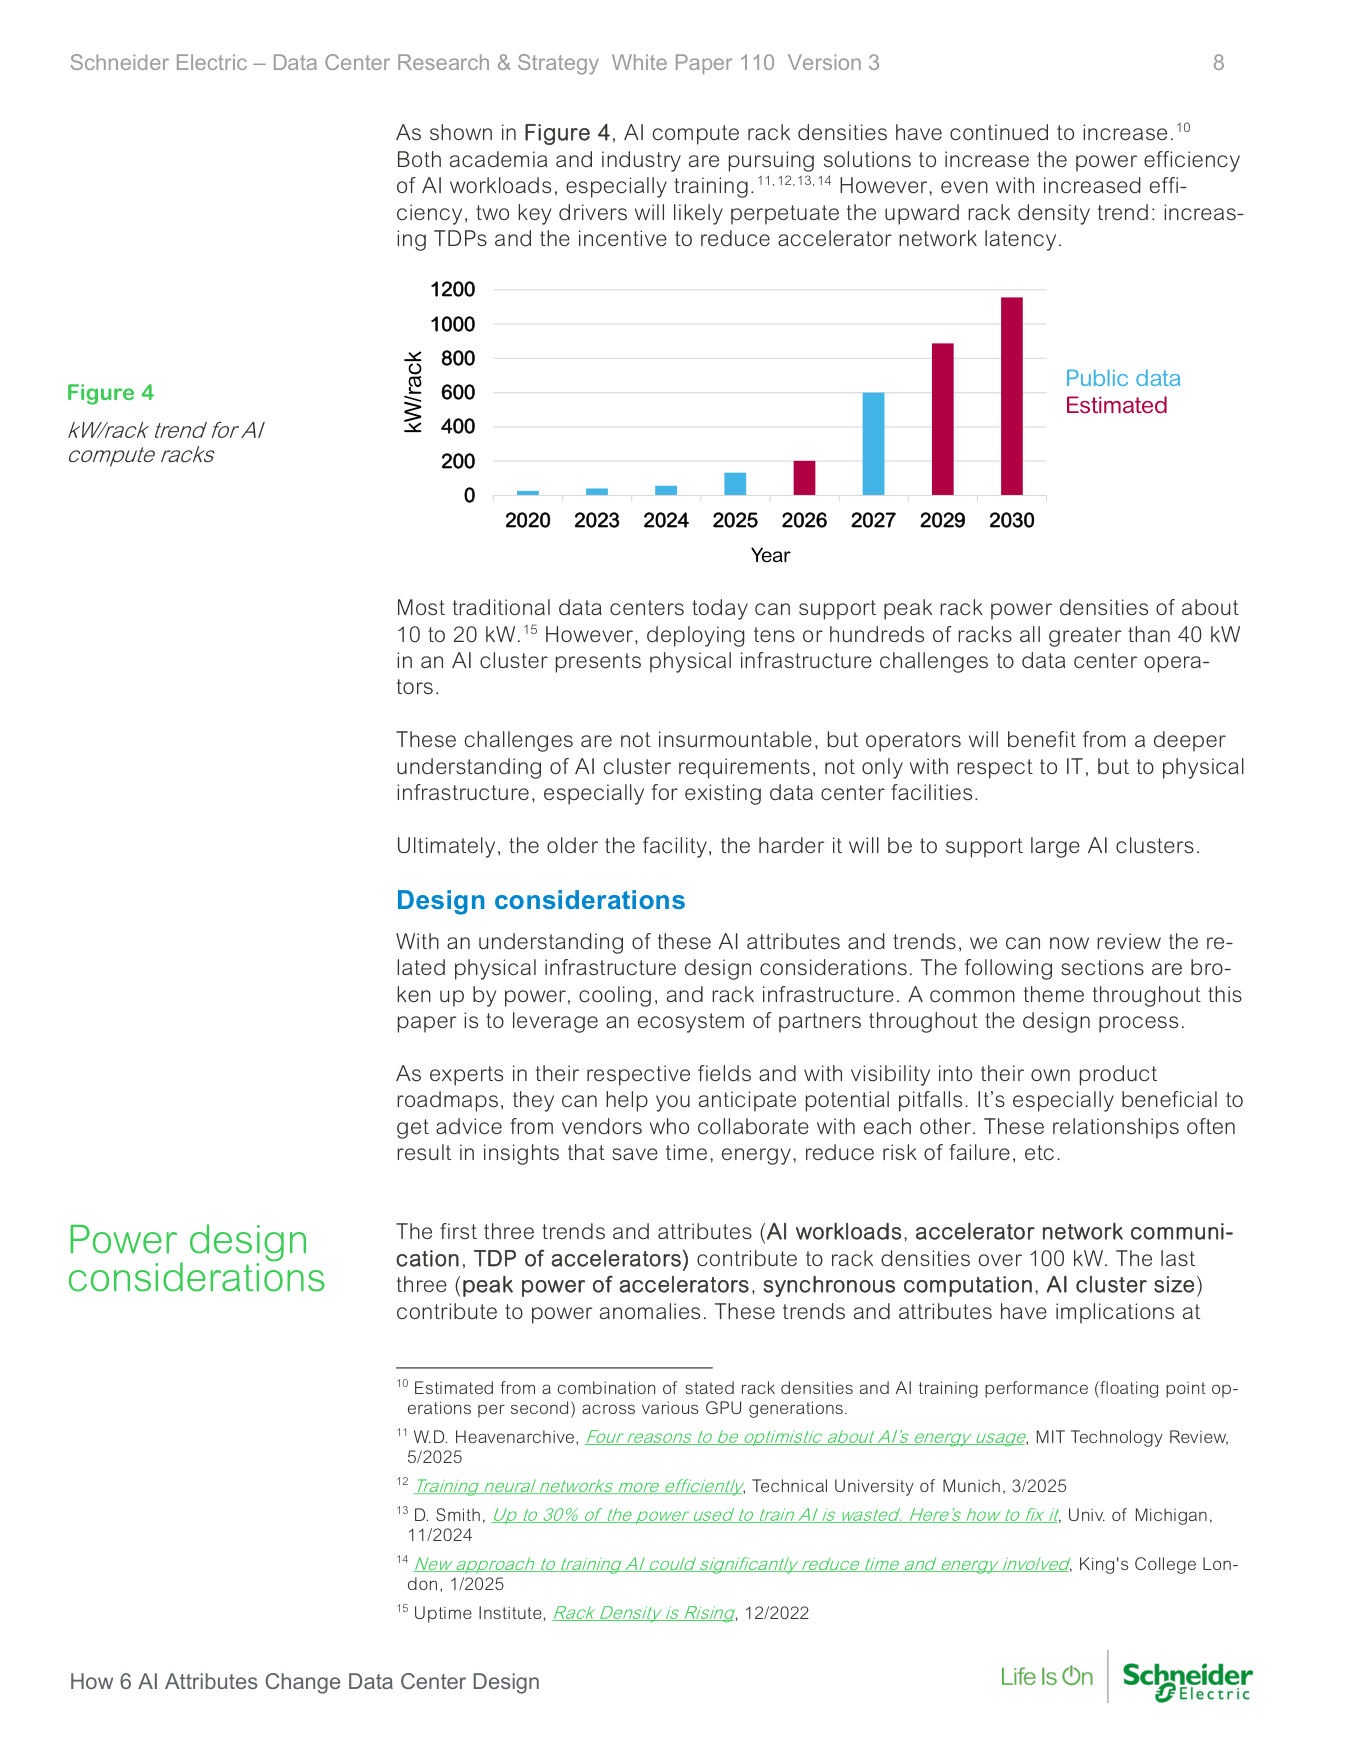
- Traditional data centres were built for peak densities of about 10 to 20 kW, which is why the electricity room, the coolant loop and the floor loading decide more than the accelerator model does.
- The utility queue has become the long pole: in some major markets, securing new power capacity takes three to four years, longer than building the facility.
- Amazon's argument with host communities is a power-procurement argument. More than 100 moratoriums are under consideration, against 44 GW of capacity under development.
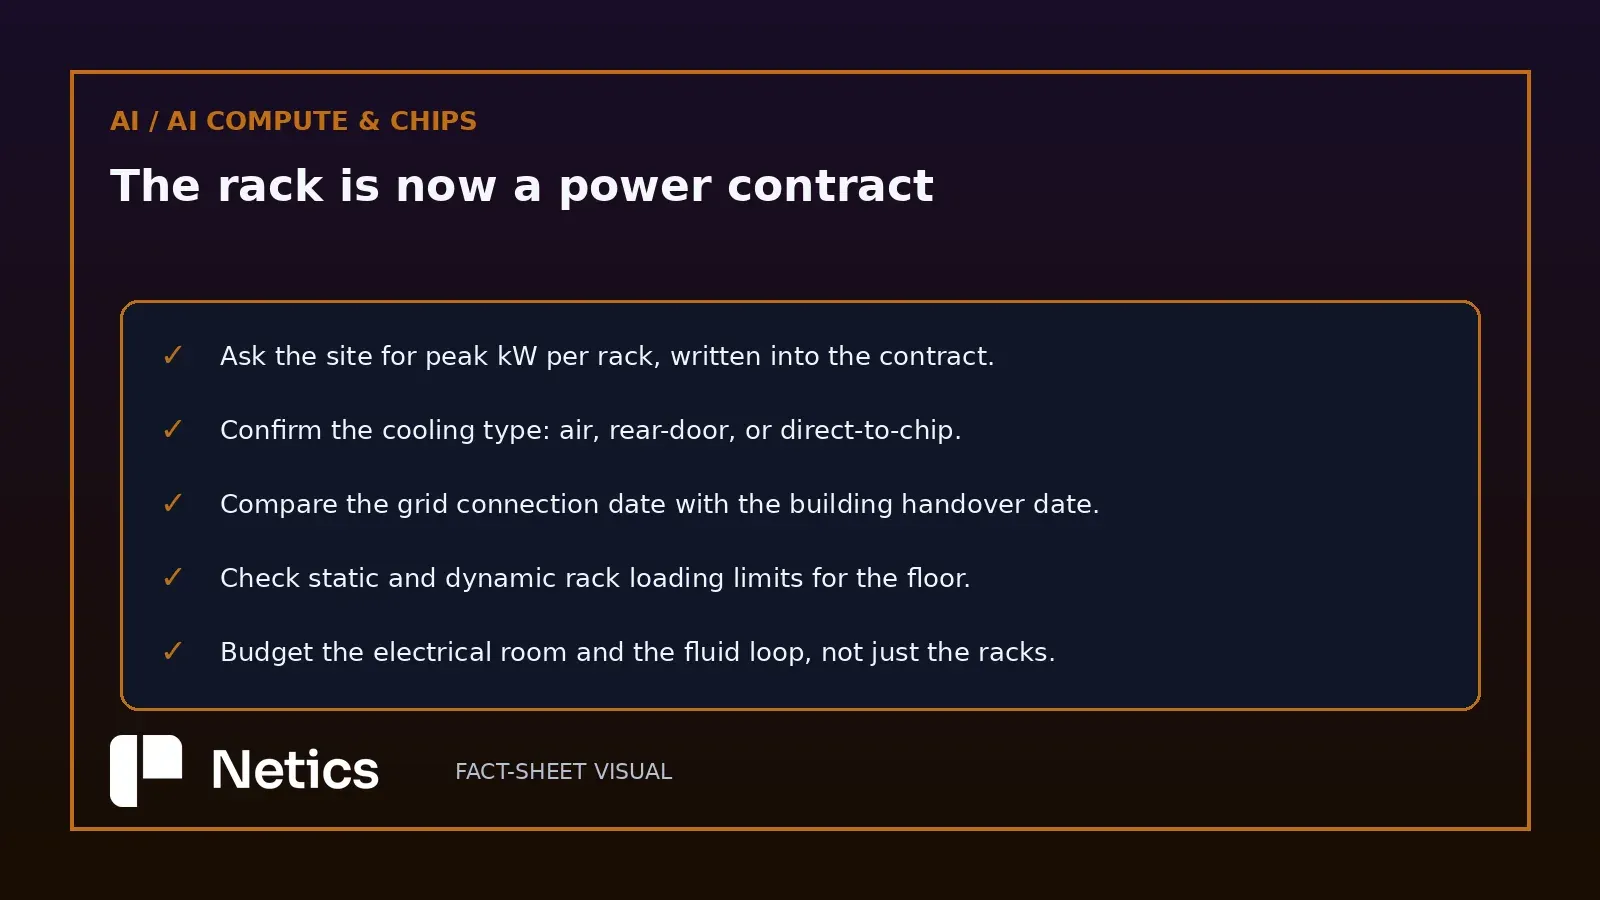
- Five numbers belong in a colocation contract: peak kW per rack, cooling type, grid connection date, floor loading limits and who owns the fluid loop.
The density figures a site contract has to answer for
Schneider Electric's data centre team published the year-on-year movement in July 2026, and the compression is the story. Average rack density went from approximately 16 kW in 2025 to 27 kW in 2026. Forecasts put the average near 40 kW within a few years. At the top of the range, the newest AI systems reach up to 246 kW per rack, the figure Schneider Electric and AMD specify in their Helios reference design and the ceiling NVIDIA's Vera Rubin platform is sized against.
Those numbers describe a different building. Most traditional data centres support peak rack densities of about 10 to 20 kW, a range that comes from an era of air cooling and a handful of kilowatts of average load per cabinet. Put a 132 kW rack design such as NVIDIA's GB200 NVL72 into that room and the limits that bind are the rack power distribution unit, the coolant supply, the weight on the slab and the upstream transformer.
Why the constraint moved to the electricity room
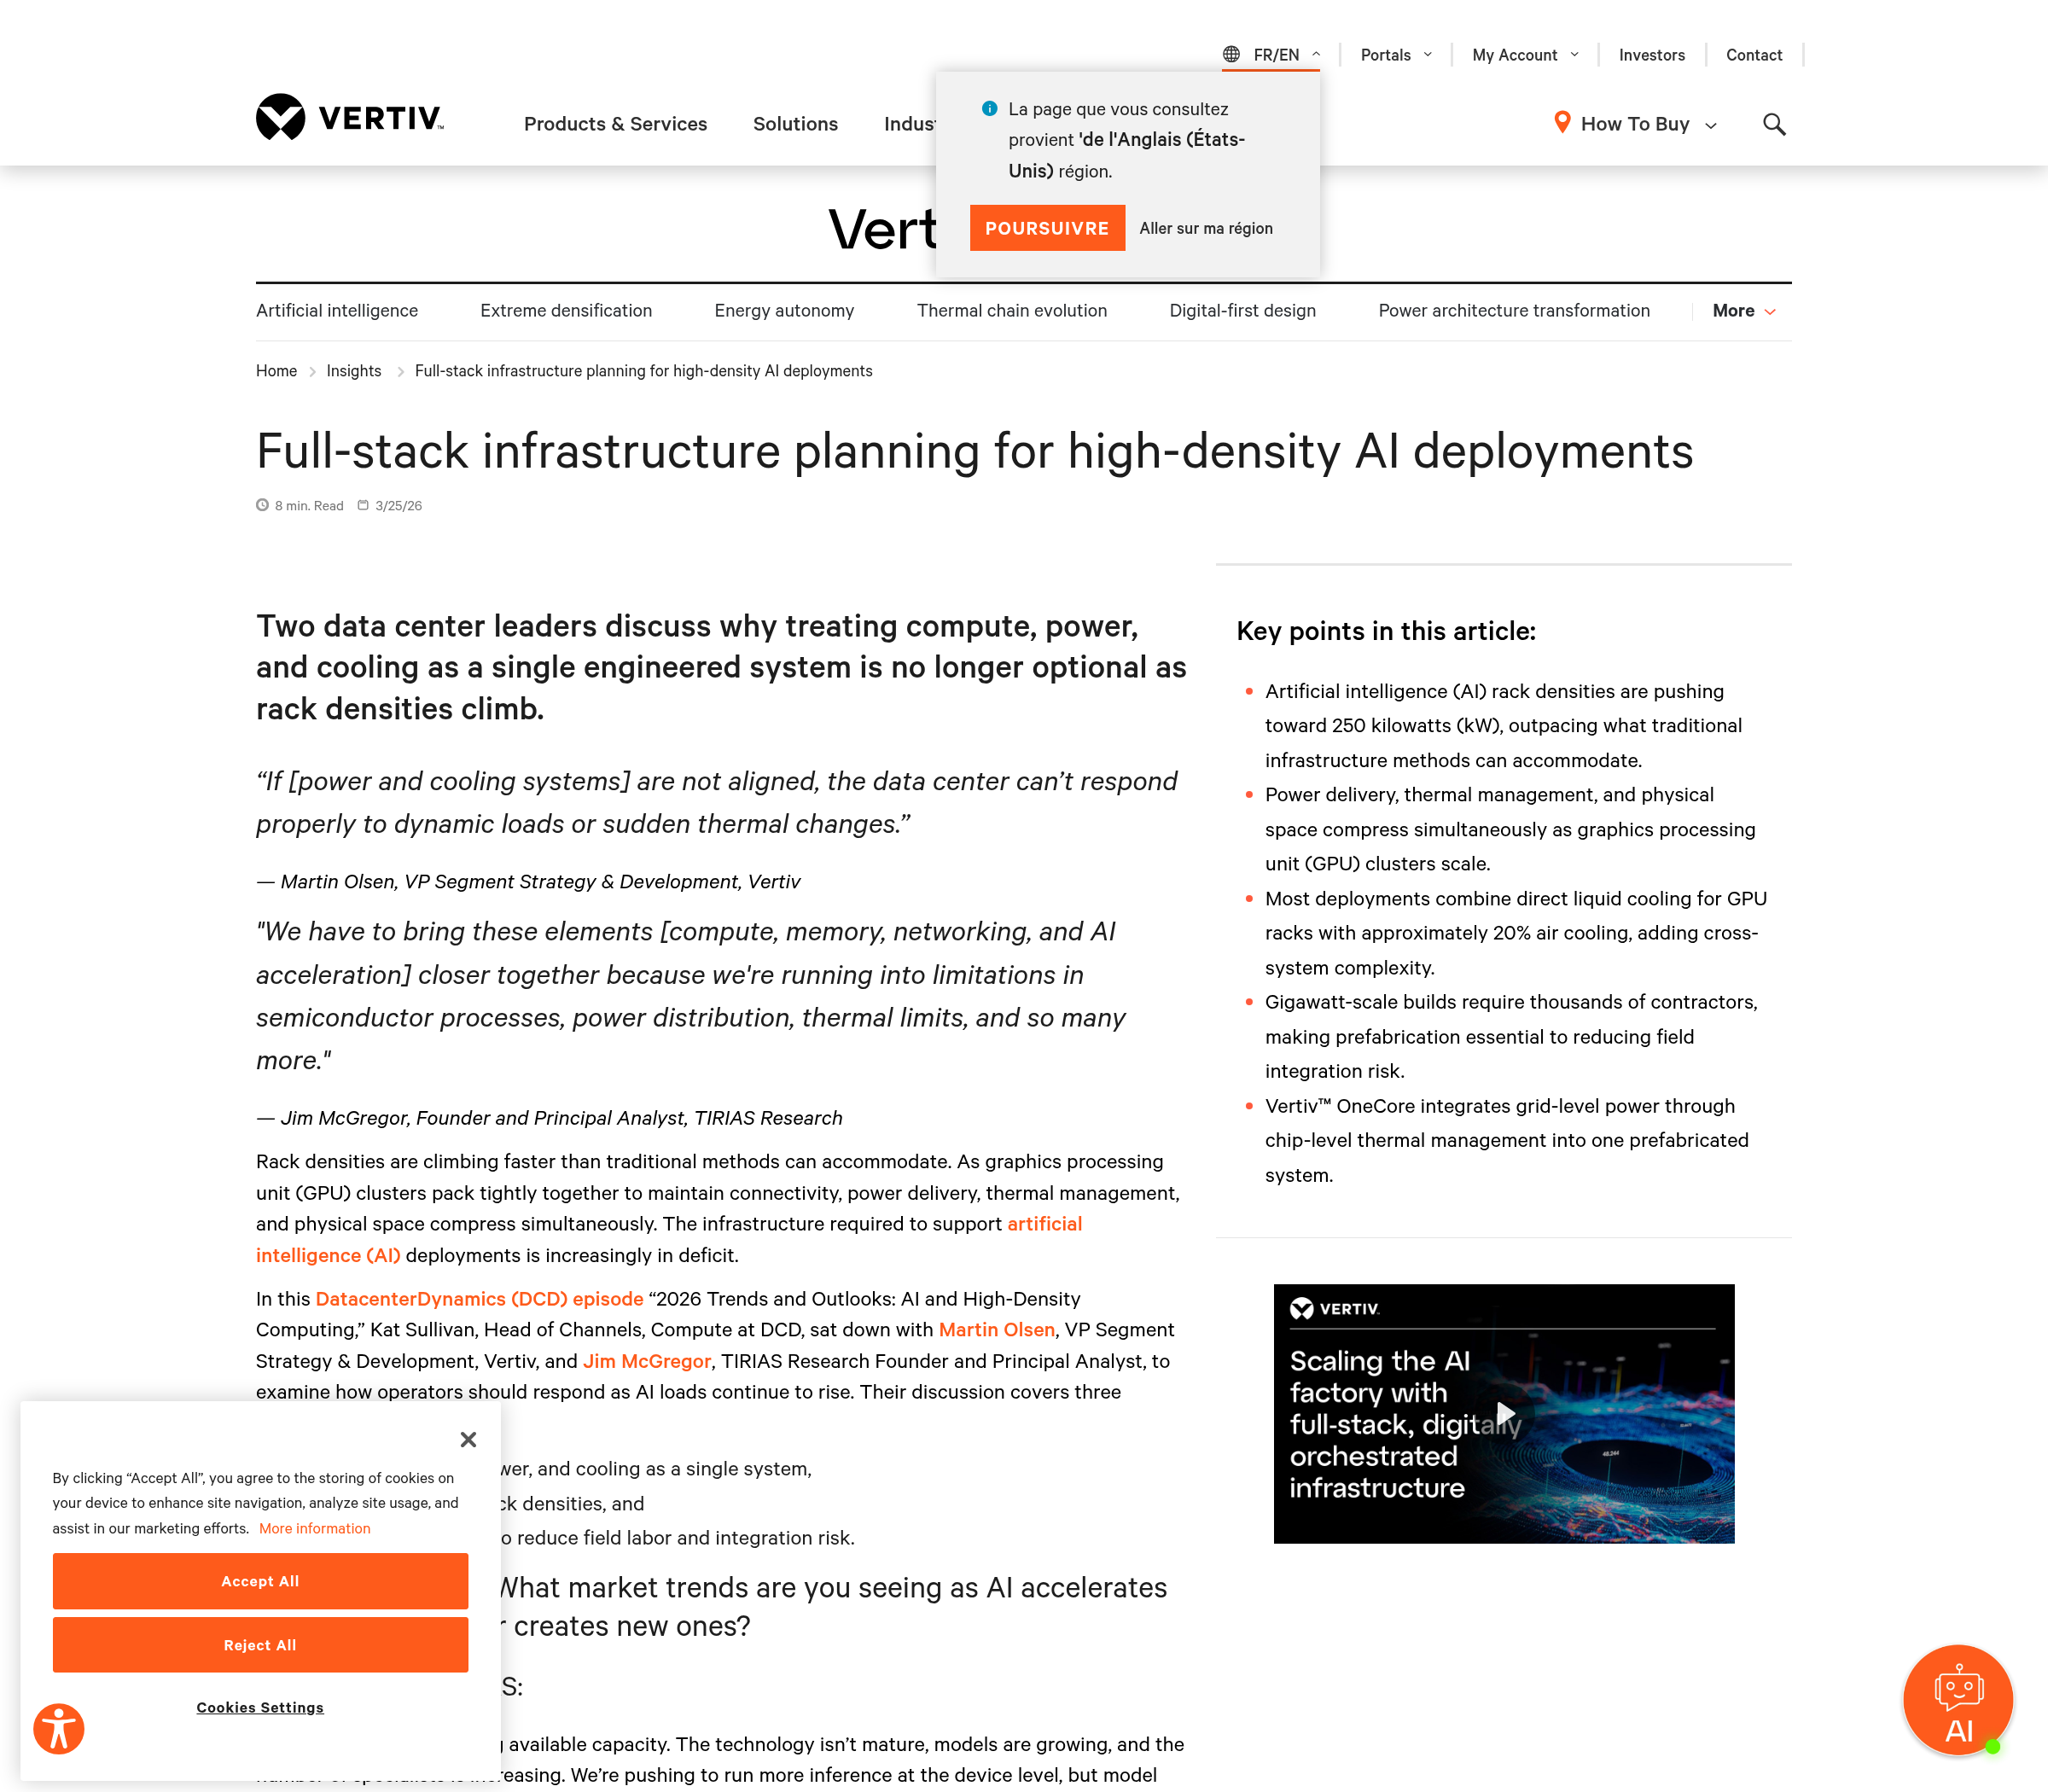
Vertiv's planning guidance describes the same shift from the cooling side, and it is blunter about the consequence. Rack densities that were up to 35 kW have moved rapidly to up to 140 kW, and new generations are pushing toward 240 to 250 kW. At the scale of 100 MW to 1 GW sites, traditional chiller plants start to dominate the site layout, which turns the mechanical yard into a floor-plan decision rather than an equipment choice. Most deployments end up mixing direct liquid cooling for the GPU racks with roughly a 20% air component, and that hybrid is where the integration complexity lives: two cooling paths, two sets of failure modes, and a set of standards for coolant properties and interfaces that the industry has been slow to agree on.
There is a second-order effect that a buyer feels before a technical one. Schneider Electric estimates global data centre electricity demand at approximately 132 GW in 2026, climbing toward 290 GW by 2030. Utility interconnection queues are the bottleneck in that arithmetic: in some major markets, securing new power capacity takes three to four years, which is longer than constructing the building. Time to power has become the number that sets the schedule, and it is a queue position rather than an engineering problem.
The physical limits that show up in the white papers
Schneider Electric's White Paper 110 lists the constraints that decide whether a hall is usable, and they are refreshingly unglamorous. AI clusters push rack densities and weights over 100 kW and over 1,300 kg, which is why the same document recommends specifying racks with a static weight capacity above 2,270 kg and a dynamic capacity above 1,600 kg, and validating that concrete slab floors are rated for loads over 3,000 kg. In the back of a standard cabinet, there is often not enough space left for the rack PDUs and the coolant manifolds once the servers are in.
The paper also states the cost of missing standards plainly: the absence of industry-wide specifications for coolant properties, interfaces and integration increases retrofit cost and uncertainty. Any operator weighing a move to high-density AI workloads is therefore deciding with incomplete comparability, which is an argument for demanding measured values from vendors rather than datasheet ceilings.
Amazon's community fight is a power-procurement fight
Amazon's response to local opposition is worth reading as a procurement document, because that is what it is. The company's October post, signed by AWS chief executive Matt Garman, says more than 100 data centre moratoriums are being considered across the United States, and warns that enacting them would mean the country writing "its own losing ticket to this race, and the consequences would last generations." The counter-offer is money and disclosure: more than 1 billion US dollars over five years through the Built Together programme, no more non-disclosure agreements with local governments, annual public reporting on energy and water use, and commitments to cover the full cost of power and grid upgrades so that household rates are unaffected.
The scale behind the argument explains the urgency. Distilled Earth's analysis of utility filings and interconnection studies counts 44 GW of Amazon data centre capacity under development in the United States, up from 7.4 GW when ChatGPT launched, with 27 GW of that in 13 new states and a single 1 GW campus in New Carlisle dedicated to Anthropic. The report counts 25.6 GW of contracted carbon-free electricity and 17.5 GW of new gas generation being built by utilities to serve the load. Against that, Garman's local numbers are the negotiation: a project in St. Joseph County, Indiana, estimated to pay more than 3 billion dollars in taxes where the previous land use would have paid 1.2 million, and an average Amazon facility using less than 13,000 gallons of water a day against a cited industry figure of 170,000.
The five numbers that belong in the contract
For a team renting space rather than building it, the useful discipline is to convert the vendor's marketing into five answers written into the agreement.
- Peak kW per rack, per cabinet position, with the upstream limit stated rather than implied.
- Cooling type available at that density: air, rear-door heat exchanger, or direct-to-chip, and the coolant supply temperature the site actually runs.
- Grid connection date, separate from the building handover date.
- Static and dynamic floor loading limits for the specific hall, checked against the rack you intend to install.
- Ownership of the fluid loop and the maintenance window, because a liquid-cooled rack that loses its loop is an outage with a different failure mode.
The same question for a team with four racks
Take a concrete case. Imagine a twenty-person software company in Lyon running a small AI workload on four racks, with a two-rack inference cluster planned for next year. The decisive number is the power the room can deliver: the colocation hall offers 12 kW per rack, the same operator has a second hall at 30 kW, in a building whose grid connection was upgraded two years ago and whose expansion depends on a queue position it does not control. The realistic plan is disciplined: keep the inference cluster inside the 12 kW ceiling, schedule the denser racks against the site's own capacity plan, and price the difference between the two halls rather than the difference between two GPUs.
That calculus is also where facility decisions turn into sovereignty decisions, because the site with available power is increasingly the site outside the busiest markets, and sovereign infrastructure and cloud exit planning starts with the same question a colocation contract asks: what capacity do you actually control. Our earlier reading of the Anthropic-Akamai capacity deal covers the commercial half of that buildout, where the money sits in the layer that serves the accelerators.
Sources
Source: Data center power density: Why liquid cooling and grid constraints now decide where AI compute lands — blog.se.com/datacenter/2026/07/28/data-center-power-density-planning-liquid-cooled-ai-data-centers-around-grid-and-power-constraints/, Schneider Electric, published 28 July 2026, retrieved 2026-10-05 (average rack density from approximately 16 kW in 2025 to 27 kW in 2026; one operator in five reporting readiness for 50-70 kW racks; forecasts near 40 kW; newest AI systems up to 246 kW per rack, the figure NVIDIA's Vera Rubin platform is sized against; global data centre electricity demand approximately 132 GW in 2026 toward 290 GW by 2030; new power capacity taking three to four years in some major US markets; legacy air-cooled PUE 1.55-1.67 against 1.10-1.20 for direct-to-chip liquid cooling; the TeraWulf Lake Mariner campus and its phased path to 750 MW). Source: Full-stack infrastructure planning for high-density AI deployments — vertiv.com, retrieved 2026-10-05 (rack densities from up to 35 kW to up to 140 kW, new generations toward 240-250 kW; 100 MW to 1 GW sites; chiller plants dominating site layout; hybrid halls with roughly 20% air cooling; operating at 40-45°C to gain hours on dry coolers; prefabrication for gigawatt-scale builds needing thousands of contractors). Source: White Paper 110, How 6 AI Attributes Change Data Center Design — download.schneider-electric.com (SPD_WP110_EN), retrieved 2026-10-05 (most traditional data centres supporting peak rack power densities of about 10 to 20 kW; AI clusters pushing racks over 100 kW and over 1,300 kg; recommendation to specify static weight capacity above 2,270 kg and dynamic above 1,600 kg, with floors validated for loads over 3,000 kg; the absence of industry-wide liquid-cooling standards for coolant properties, interfaces and integration increasing retrofit cost; Figure 4 on the AI compute rack density trend). Source: Built Together — aboutamazon.com/news/company-news/amazon-data-centers-built-together, Matt Garman, published 2 October 2026, retrieved 2026-10-05 (over 100 data centre moratoriums under consideration; "If these measures are enacted, the U.S. could be writing its own losing ticket to this race, and the consequences would last generations"; more than 1 billion US dollars over five years on top of more than 1 billion in the prior three years; end of non-disclosure agreements with local governments; annual public reporting on energy and water use; commitment to cover power and grid upgrade costs; a typical data centre using about 170,000 gallons of water per day against Amazon's average below 13,000; St. Joseph County, Indiana taxes estimated above 3 billion US dollars against 1.2 million from the prior land use; Montgomery County, Missouri at more than 1.8 billion over 25 years against about 200,000). Source: Amazon is building 44 GW of data centers. Here's how it plans to power them — distilled.earth/p/amazon-is-building-44-gw-of-data, retrieved 2026-10-05 (7.4 GW of US capacity when ChatGPT launched, nearly doubled since; 44 GW under development with 27 GW in 13 new states; Texas at 7.6 GW and Pennsylvania at 5 GW; 69% more capacity than Microsoft and roughly double Google and Meta; 220 billion US dollars of expected 2026 capital expenditure, 3.5 times 2022; the New Carlisle campus, a 1 GW site dedicated to Anthropic; 25.6 GW of contracted carbon-free electricity; 17.5 GW of new gas generation under construction to serve the load). Internal linkage: Anthropic's $11.6B Akamai Commitment. More on Netics' work at sovereign infrastructure and cloud exit.
Source: Schneider Electric data centre analysis and White Paper 110 — blog.se.com, download.schneider-electric.com, retrieved 2026-10-05; Vertiv high-density planning article — vertiv.com, retrieved 2026-10-05; Amazon Built Together post — aboutamazon.com, 2 October 2026; Distilled Earth Amazon capacity report — distilled.earth, retrieved 2026-10-05. Figures: screenshot of Vertiv's article and the rendered density-trend page from Schneider Electric White Paper 110, captured 2026-10-05.