
AlloyDB Omni Adds a Read-Only Web UI for Cluster Observability
"Google put a read-only console on AlloyDB Omni on 28 October 2026: CPU, memory and disk I/O charts from Prometheus, slow statements ranked by latency, and columnar engine coverage, with no

TL;DR
- AlloyDB Omni is a downloadable, self-managed edition of AlloyDB that keeps full PostgreSQL compatibility and runs on infrastructure a company operates itself.
- Google announced general availability of a web UI for AlloyDB Omni, covering Red Hat RPM installs and container deployments.
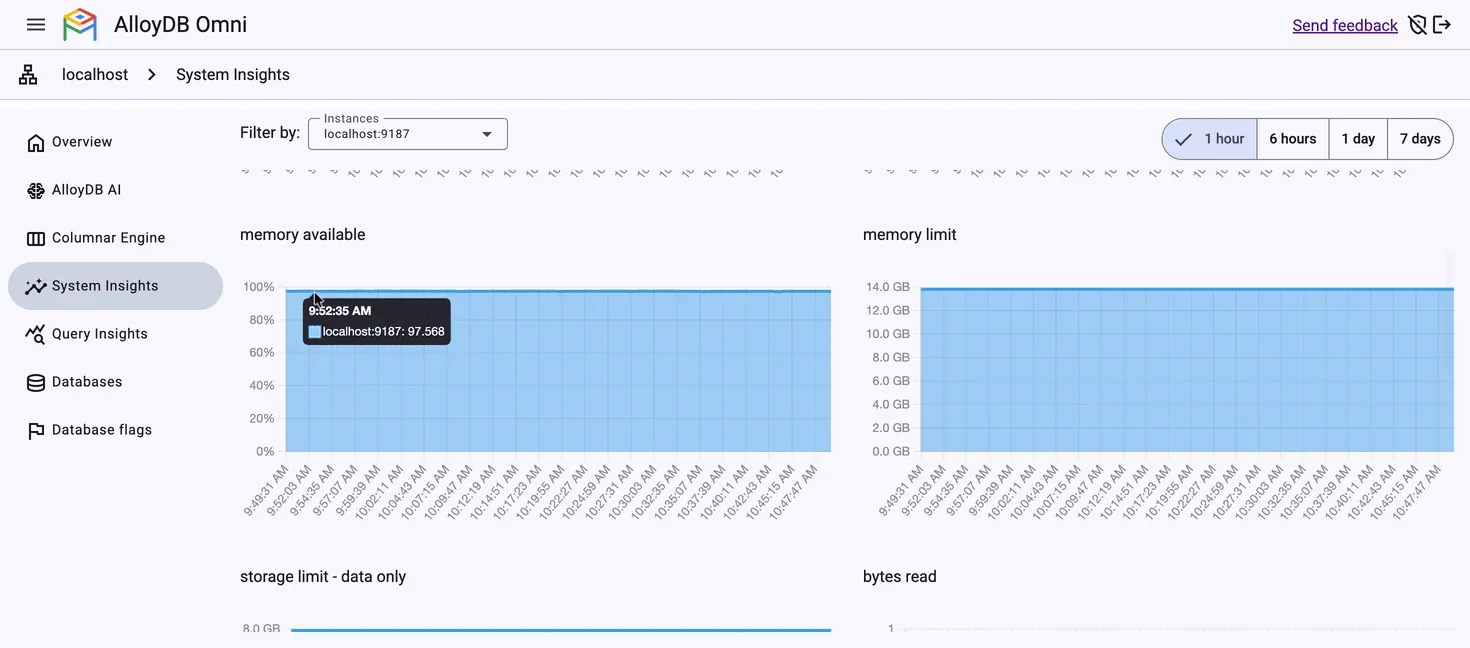
- The console is read-only by design: it shows cluster health, CPU, memory and disk I/O charts fed by Prometheus, and slow statements ranked by latency, in its read-only interface.
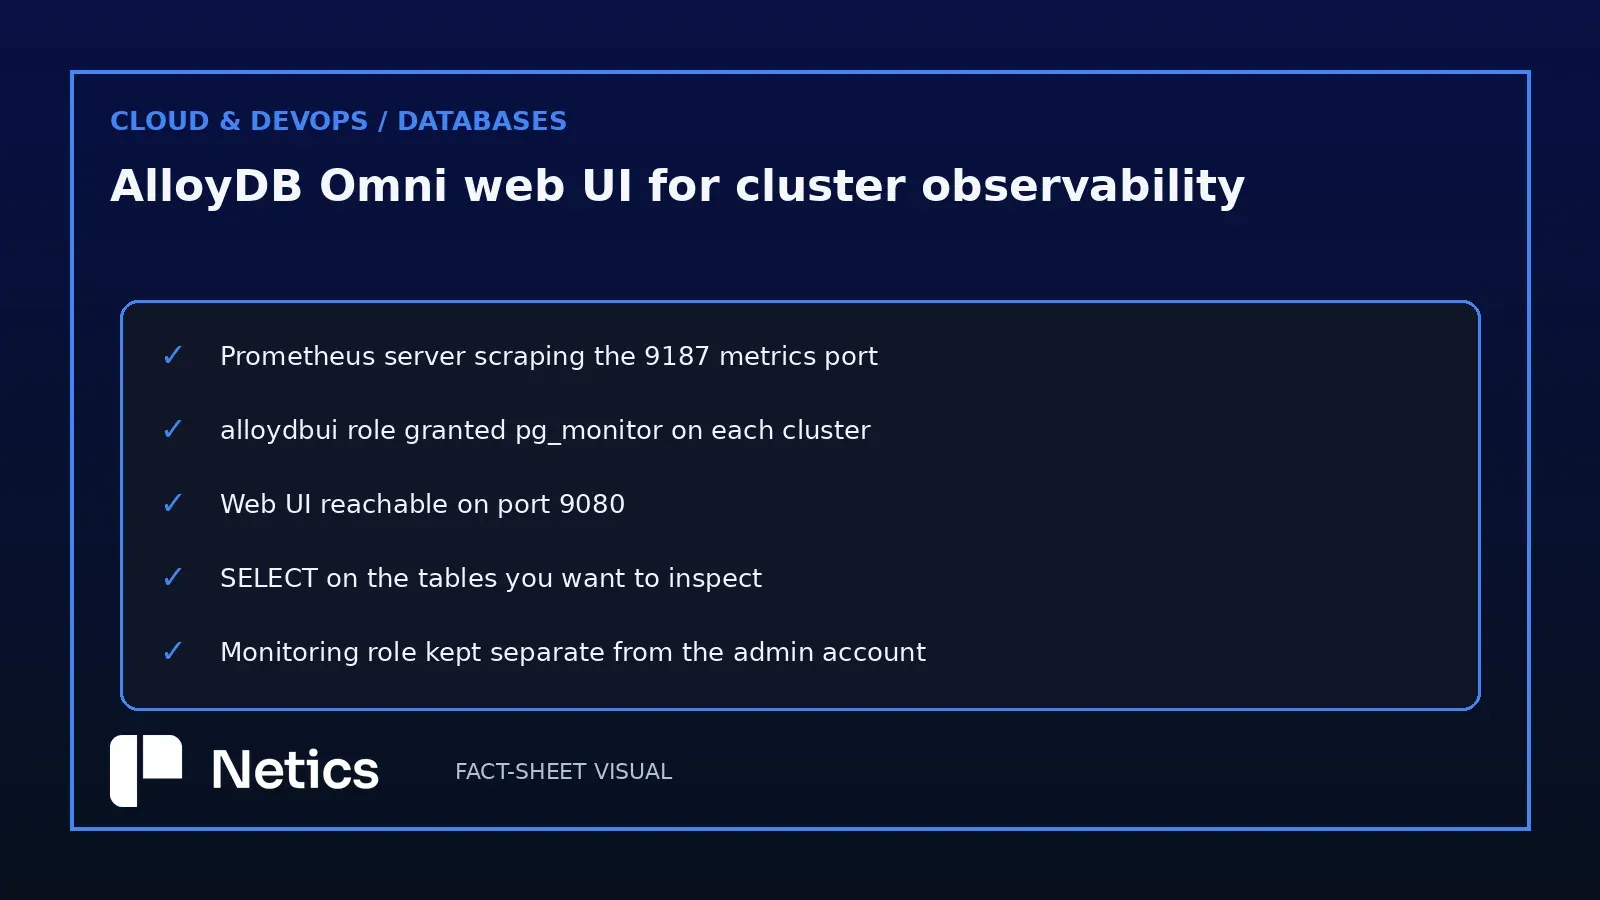
- The prerequisites are operational: a Prometheus server for the charts, an alloydbui role holding pg_monitor on each cluster, and the interface reachable on port 9080.
- Coverage has holes worth knowing before deployment: standalone container installations lose the chart panels, and Columnar Store views require table privileges.
- The console records configuration drift for remediation through the provisioning workflow. Google explicitly identifies the provisioning workflows used for corrections: Kubernetes CRDs or GitOps manifests, Ansible playbooks, or alloydbctl.
The Google Cloud blog published Introducing the AlloyDB Omni web UI for easier cluster observability, signed by Omkar Deshmukh and Josh Choinsky. Google describes the operational problem directly: command-line tools make cluster health harder to see and issues harder to diagnose quickly.
Google's framing of the problem is that managing PostgreSQL across on-premises, edge and multi-cloud environments "often forces administrators to rely on command-line tools, making it hard to see cluster health and quickly diagnose issues." The console is the answer it shipped: a production-ready, read-only view of hardware telemetry, query performance and configuration flags, available for Red Hat RPM installations and for containers.
What the console shows in its read-only interface
The cluster overview is the anchor. Connection profiles let an administrator keep local, staging and production targets side by side and switch between saved profiles. Under that, the panels are the operational ones: CPU use, memory allocation, storage I/O and active connection trends, plus a ranked list of statements by total latency and call frequency.
That ranking gives a DBA a direct view of the statements with the highest total latency. Slow queries sort themselves to the top, so an unindexed statement shows up as a latency row. The interface runs its own limited account for this, and the documentation names it: an alloydbui role granted pg_monitor on each cluster.
The read-only constraint is the design decision
A console with read access to a production database requires a product review covering data exposure and diagnostic permissions. Granting change authority adds write operations and configuration changes to that review. Google kept the first: the interface operates strictly in read-only mode, which means a diagnostic session cannot execute write commands or alter database configuration.
The value of that boundary is administrative. The read-only boundary gives an access review a concise scope covering diagnostic permissions and the exclusion of write commands and configuration changes. An administrator account requires a review of its write and configuration permissions. The same logic explains why the provisioning workflow keeps its authority: Google points at Kubernetes custom resources and GitOps manifests, Ansible playbooks and alloydbctl as the places where changes are made.
Charts come from Prometheus, and the role comes from you
The panels do not generate their own telemetry. To see time-series charts for CPU, memory and disk I/O, the environment needs a Prometheus server scraping the exporter, and the AlloyDB Omni Kubernetes operator runs a monitoring agent that exposes Prometheus-compatible metrics on port 9187. The interface itself is reached on port 9080.
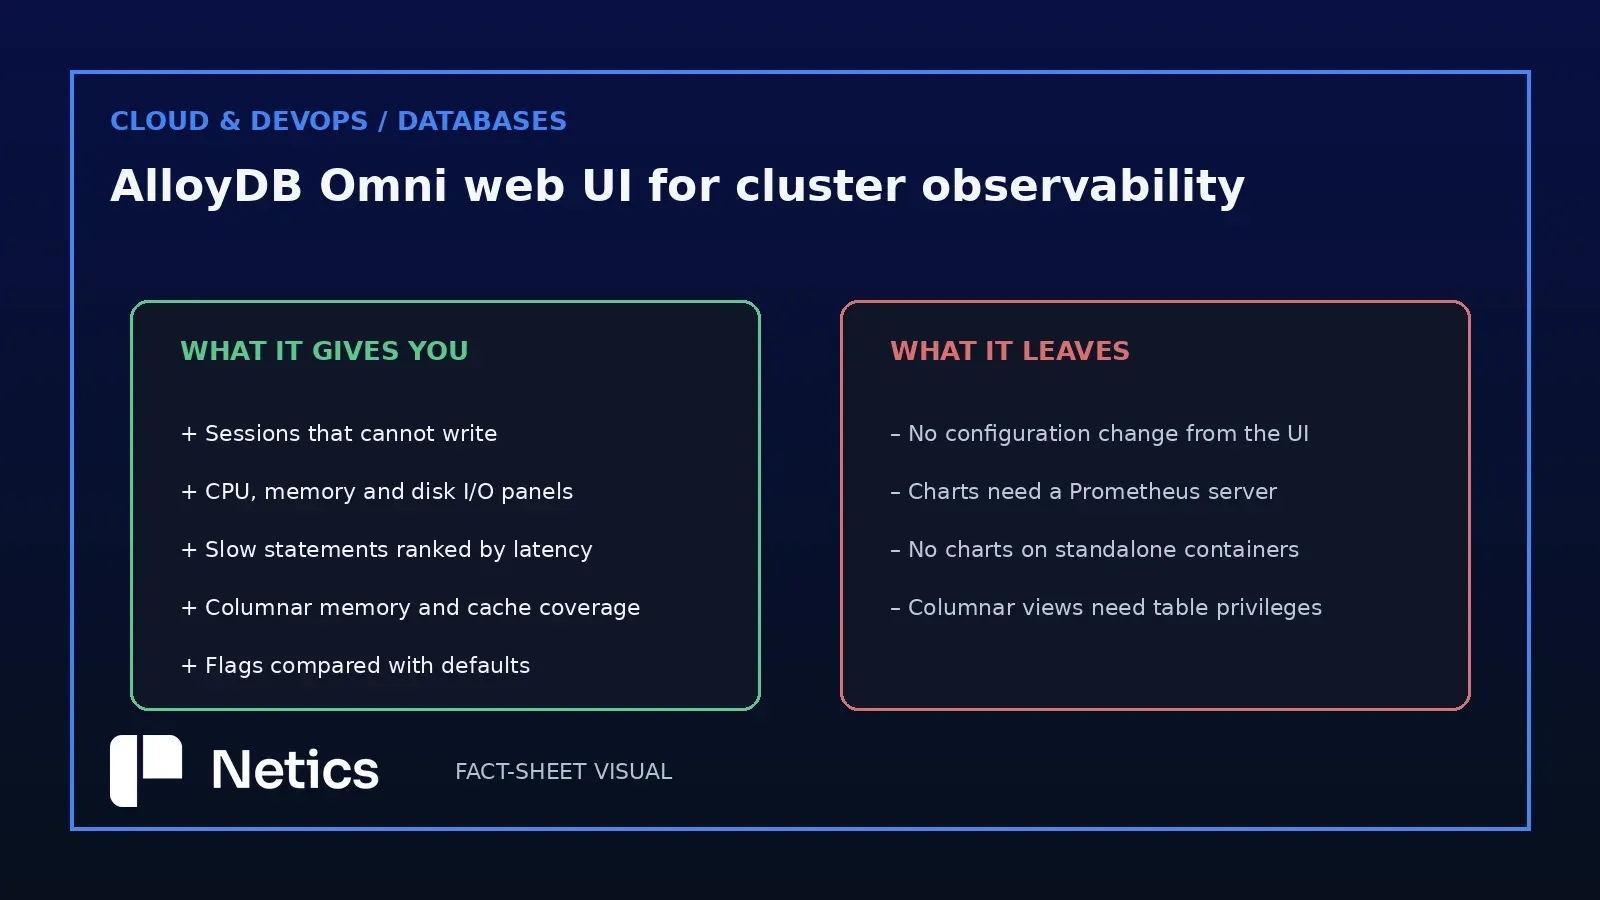
Two consequences follow, and both are ordinary for teams that already run self-managed databases. First, the console adds a dependency on a service you operate, so a broken Prometheus shows up as empty charts, which is the honest failure. Second, the role has to be created per cluster with the right grants, and the documentation is specific about what each view needs: at least one permission on a table to see its Columnar Store data, SELECT on tables for the Vector Columns section, and SELECT on pg_stat_ann_indexes for vector index data.
The narrow permission set is the interesting half of the design. A monitoring account limited to pg_monitor and a handful of catalog views gives a third-party dashboard a narrow privilege scope, documented as a single line in an access review.
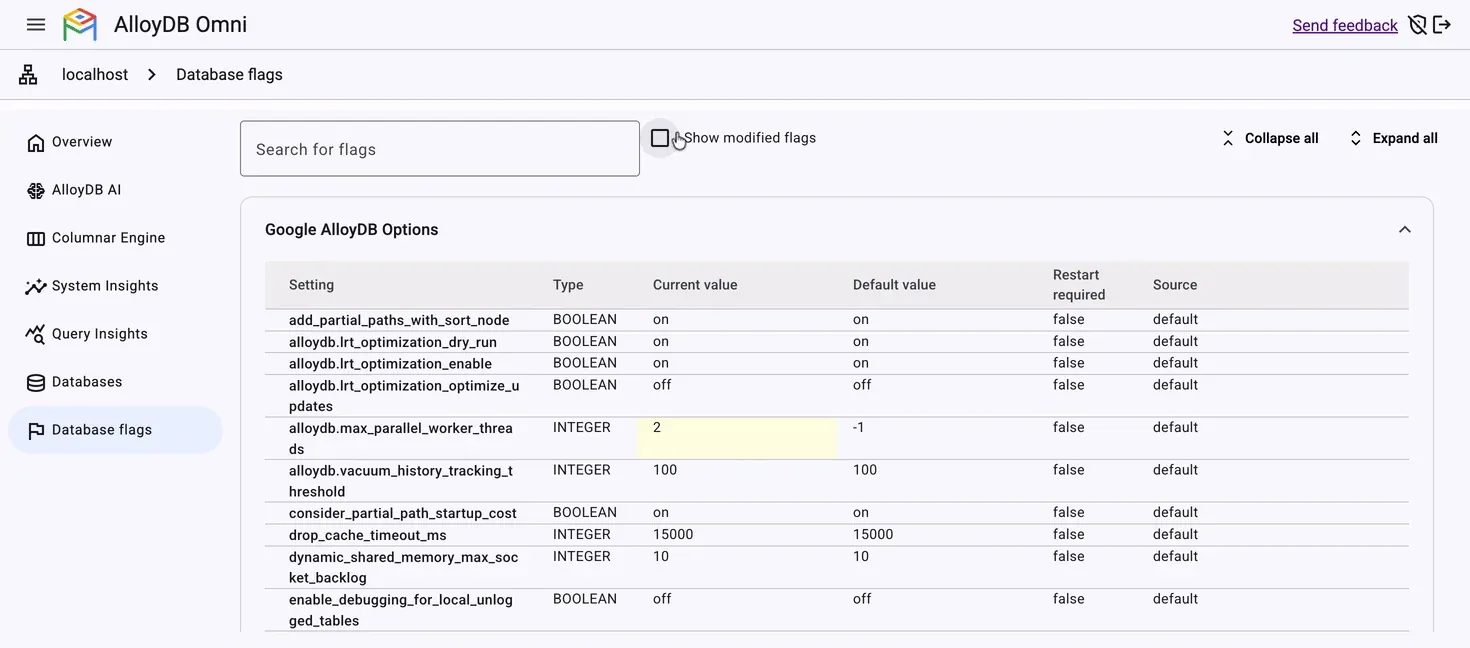
Anyone doing custom web and mobile development against Postgres will recognise the drift problem the flag view addresses: settings that differ between staging and production and become visible in a central, queryable catalogue.
Columnar engine and vector index coverage
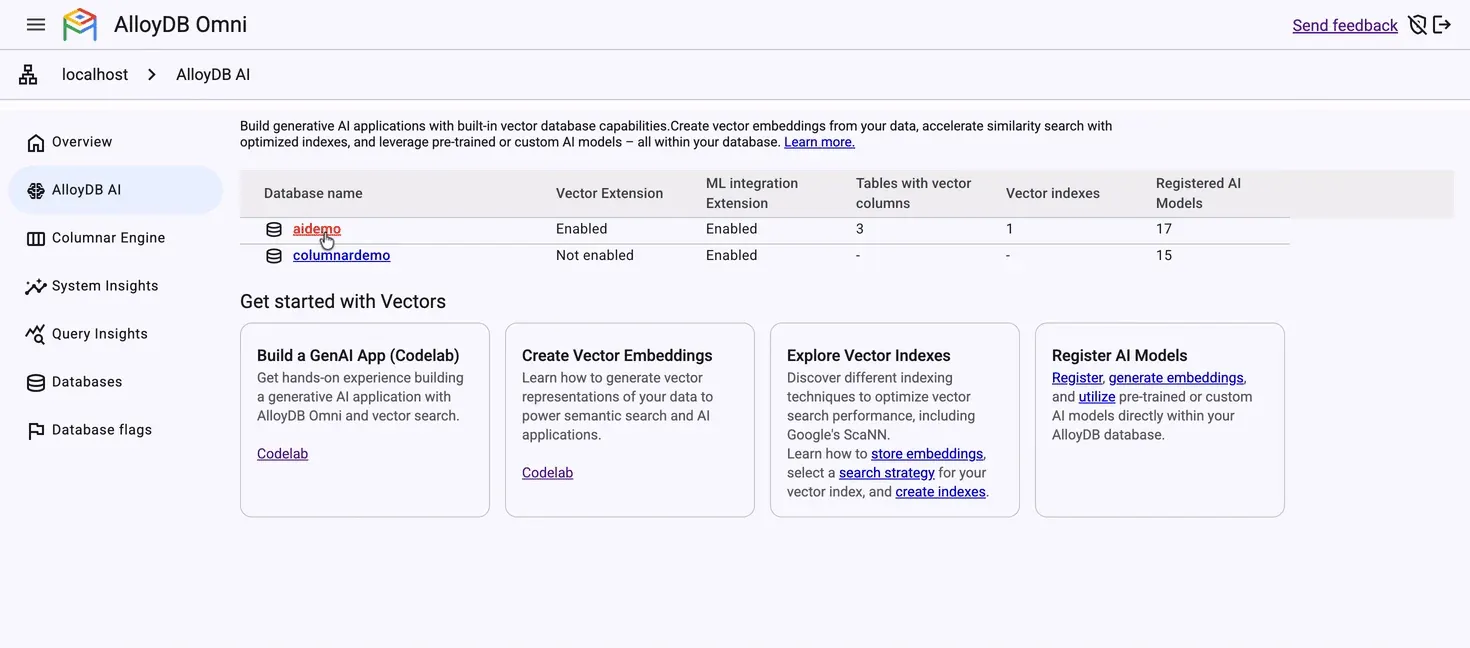
AlloyDB Omni ships a columnar engine that keeps frequently accessed data in memory to accelerate analytical queries. The console tracks its memory footprint against the hardware limit and shows which tables and columns are actually resident, giving the team direct evidence of how the acceleration feature is operating.
The same panel family gives direct visibility into vector search workflows and AI model integrations, while the documentation lists vector index data and vector column data.
Drift detection stops before remediation
The flag audit is a catalogue of active database parameters, filtered so that settings differing from the engine defaults stand out. Read that as a drift detector: it answers what changed, and it leaves the correction to the pipeline that owns configuration.
For an estate spread over bare metal, containers and Kubernetes, that split is the correct one, and it also sets the limit of what the console can promise. A team needs a GitOps or Ansible path for database parameters to remediate the drift exposed by the console. The console makes the gap visible and leaves the remediation work to the team.
That is the same discipline monitoring that explains an incident keeps pushing toward: an explanatory view connected to the workflow that performs remediation.
What to check before installing it
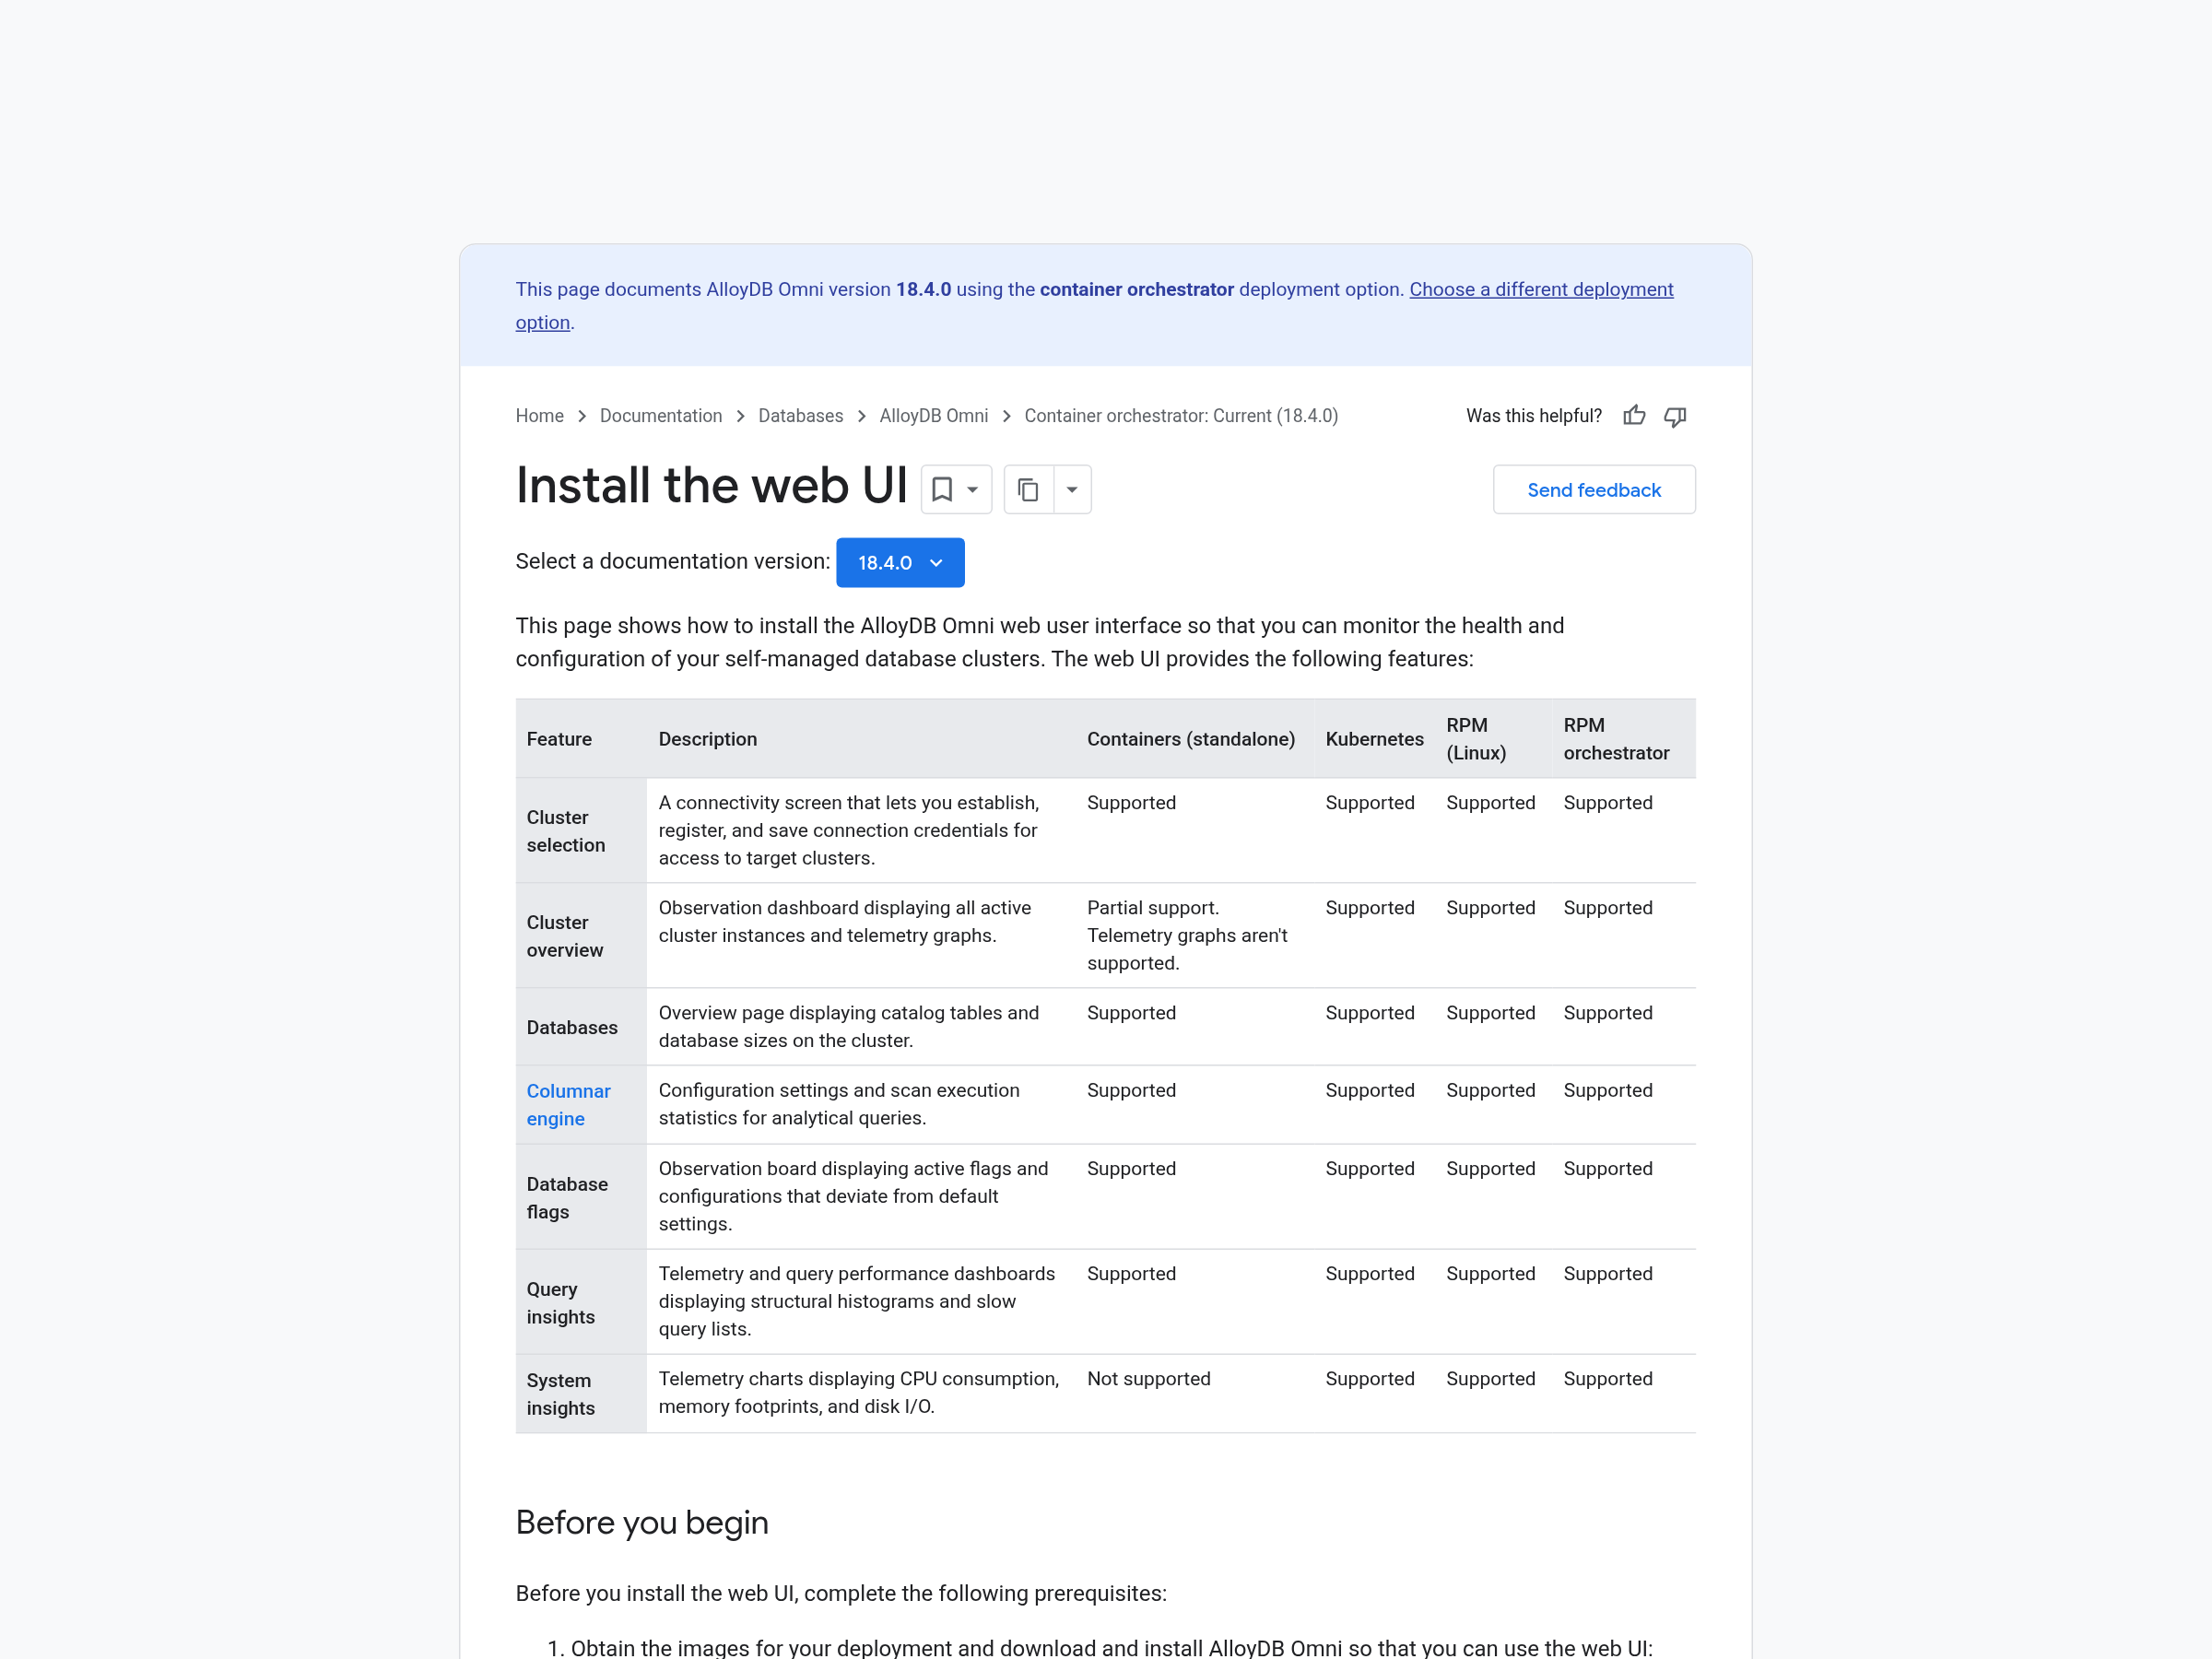
Start with the deployment type, because the support matrix is not uniform. On standalone container installations the telemetry charts and the system insights panels are unavailable, since the containerized monitoring agent does not exist for that shape; the catalog views and the flag audit still work. Kubernetes, Red Hat RPM and the RPM orchestrator get the full set.
Then decide who holds the credentials. The interface stores connection profiles in a directory under the home account that starts it, encrypted with a 256-bit AES key protected by the ALLOYDB_OMNI_UI_KEYSTORE environment variable at startup. The team should manage that keystore as a secret with its existing secrets tooling.
Finally, treat the read-only boundary as a control to verify, with a test account, on a cluster where a mistake is cheap. A console that cannot write is a genuine improvement in day-to-day operations, and it earns that position only once someone has tried to make it write.
Sources
- Google Cloud Blog, "Introducing the AlloyDB Omni web UI for easier cluster observability", Omkar Deshmukh and Josh Choinsky — https://cloud.google.com/blog/products/databases/alloydb-omni-delivers-a-web-ui-for-cluster-observability
- AlloyDB Omni documentation, "Install the web UI" — https://docs.cloud.google.com/alloydb/omni/kubernetes/current/docs/install-web-ui
Source: Google Cloud's AlloyDB Omni web UI announcement, whose page displays no publication date, and the AlloyDB Omni web UI installation documentation, last updated October 26, 2026.