
Grafana Puts a Sampling Budget Behind Every Trace It Keeps
Grafana's Adaptive Telemetry spreads one sampling budget across services, keeps a trace per attribute set, and holds dropped traces by ID for 24 hours.

TL;DR
- Adaptive Telemetry is a set of Grafana Cloud controls that decide which metrics, logs and traces a team keeps and what it pays to keep them, built around the claim that cost should follow the value of the data.
- Grafana Labs published the details on 20 October 2026, alongside general availability for three trace capabilities: volumetric sampling, diversity sampling and lookups of dropped traces.
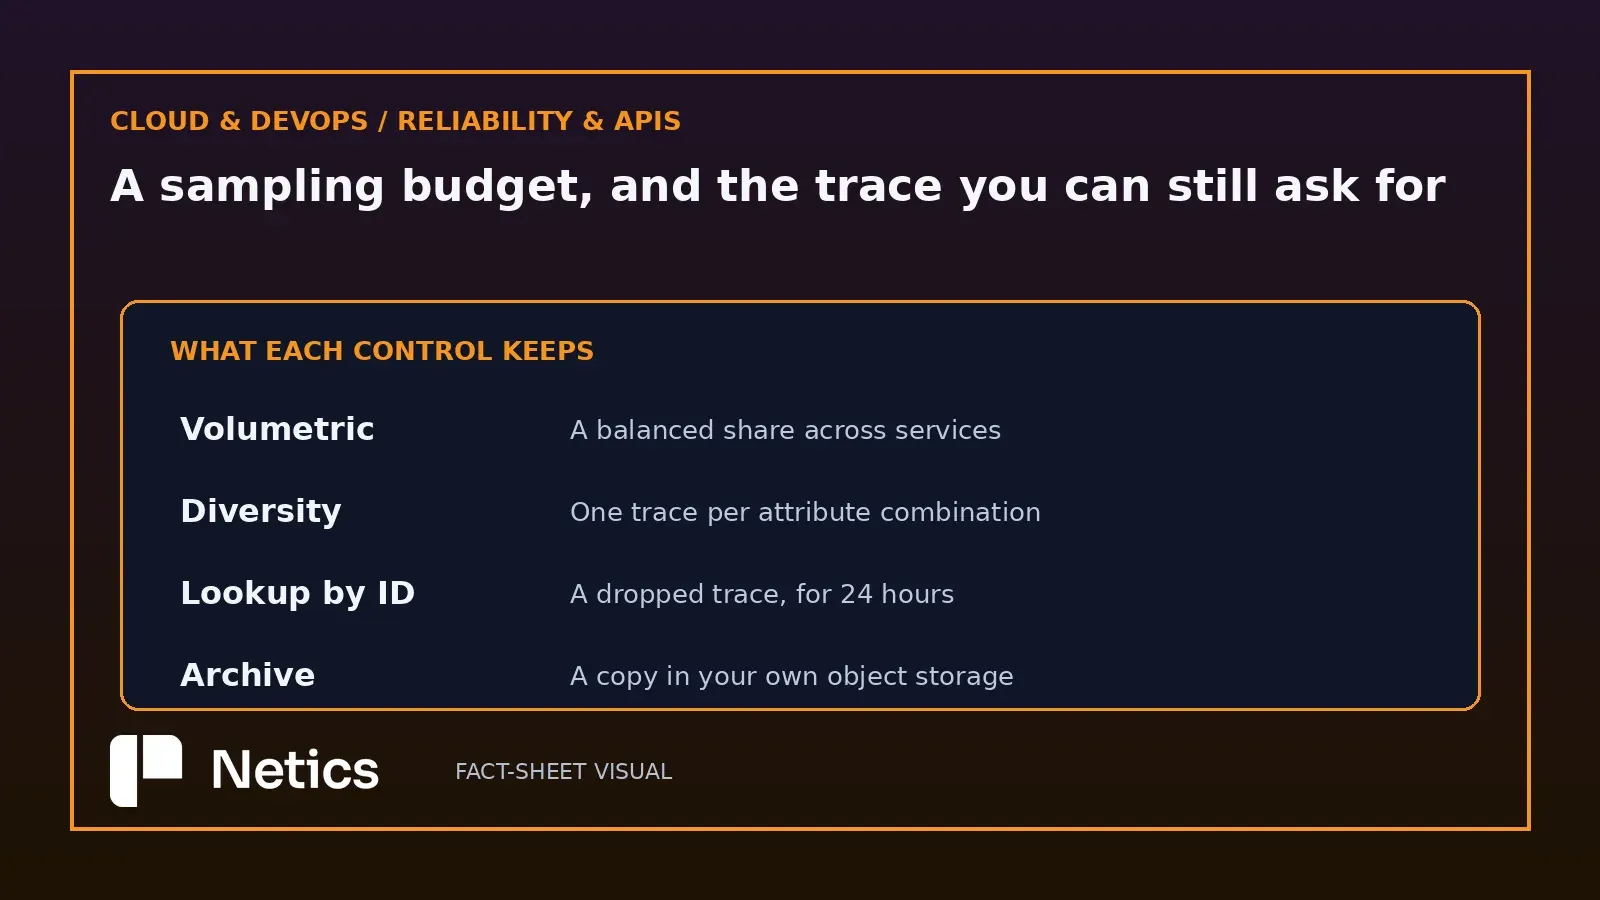
- Volumetric sampling spends one sampling percentage as a budget across services and request types, and keeps adjusting as traffic changes; Grafana Labs measured about 25% higher information density than probabilistic sampling at the same volume.
- Diversity sampling stores a unique combination of attributes every 15 minutes, so a new service or code path shows up without custom sampling logic.
- Every dropped trace stays queryable by trace ID for 24 hours after ingest, and dropped traces stay out of search and aggregations, which makes the lookup a safety net for a known ID.
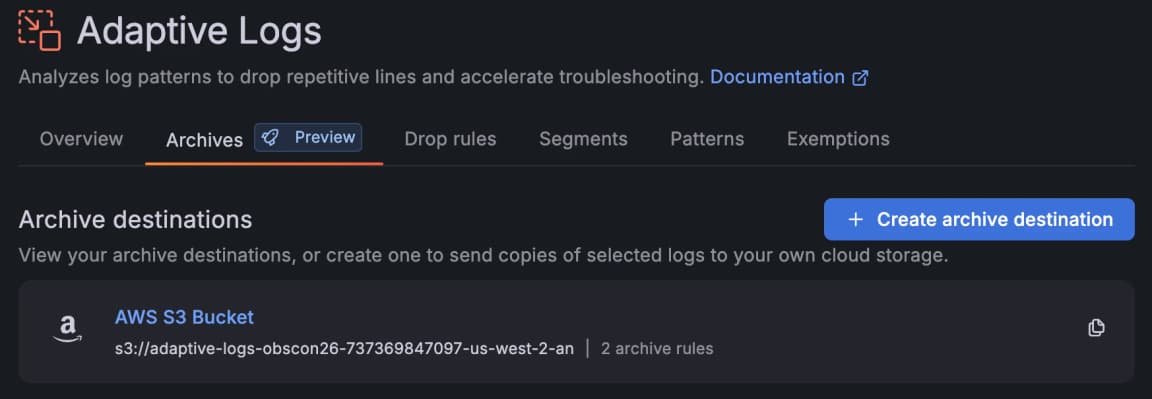
- Adaptive Logs trims patterns nobody queries, can push drop rules down to the collectors through Fleet Management, and can archive to the customer's own object storage for replay on demand.
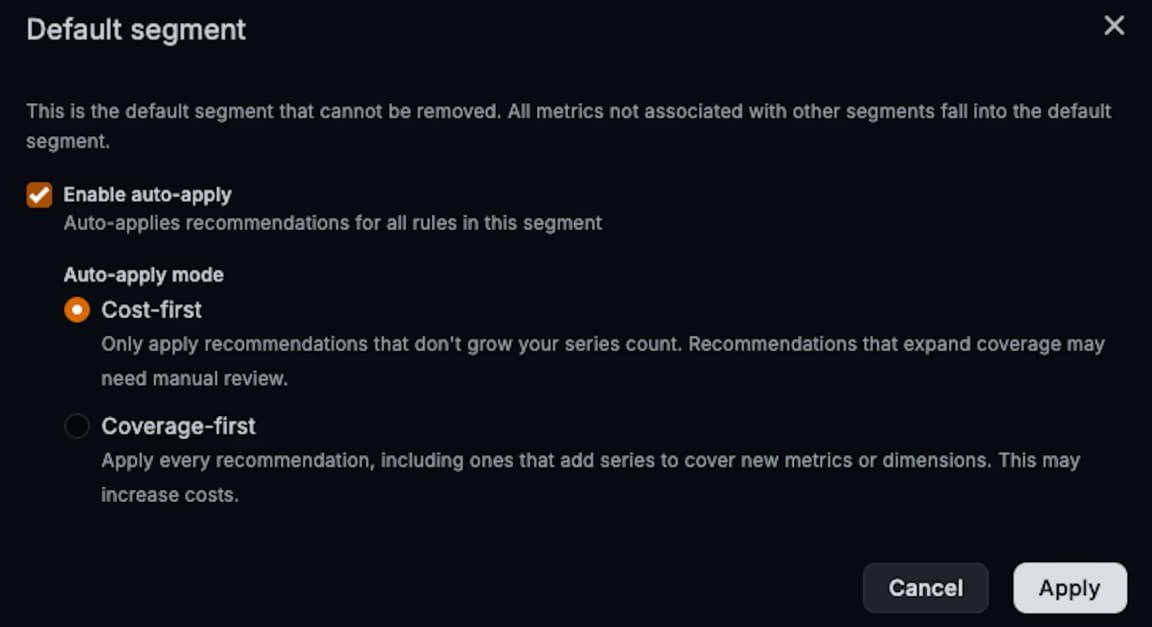
- Adaptive Metrics recommends lower-cardinality aggregation, and auto-apply can execute those recommendations in cost-first or coverage-first mode.
- The value-based framing is the part that needs local definition: someone in the company has to say which signals earn their place, and keep the trace IDs that make a lookup possible.

The bill tracks ingest, and ingest tracks every model call
Grafana Labs published Break the link between data volume and your observability bill with Adaptive Telemetry on 20 October 2026, written by JK Basra and Steven Dungan. The opening observation is that telemetry now arrives from every model call, tool invocation and agent step, and that the two standard responses, a shorter retention window and a fixed sampling percentage, cut cost by removing data nobody has chosen to keep.
The company's argument is a pricing philosophy: costs should follow the value of the data, so a team pays to keep what earns its place. Grafana frames Adaptive Telemetry around the idea that costs should follow the value of the data. Its engineering value comes from forcing a definition of value before a sampling rate gets picked. The post covers traces first, then logs, then metrics, and the mechanics differ enough to be worth separating.
The Rapid7 material sits next to the claim. Carl Eastman, a principal software engineer there, described the earlier state of the work: finding waste meant someone digging through metric cardinality and log volume by hand while new services kept adding more. A second quote gives the outcome the vendor is selling: moving to Grafana Cloud and using Adaptive Telemetry cut metrics costs enough to fund logs and traces as well.
Volumetric sampling spends one budget across services
The trace section starts from a familiar complaint. A fixed percentage treats a slow checkout request and a routine health check as the same kind of event, so lowering the rate lowers the chance that the trace you need survived. Grafana's answer is tail sampling handled inside the platform, without the team running its own sampling pipeline.
Volumetric sampling is the first of the three new capabilities. It spreads the sampling budget across services and request types so a low-volume service does not get crowded out, and it keeps adjusting as traffic changes. The operator sets one number, the sampling percentage, and writes no policy by hand. In Grafana Labs' own testing, it delivered around 25% higher information density than probabilistic sampling at the same volume.
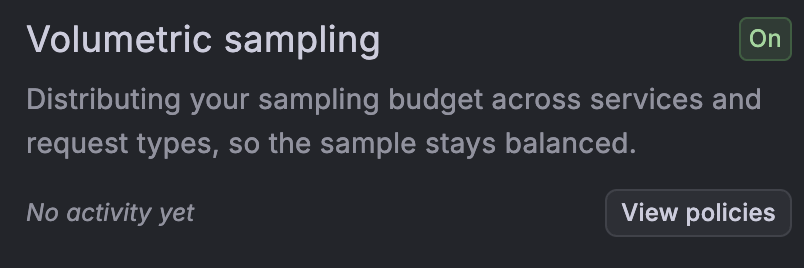
That number deserves the qualifier the post gives it. It is a vendor measurement of one property, information density, under test conditions the post does not publish. What the mechanism changes is legible from the design: a budget divided across services is a decision about fairness, and fairness is what stops a quiet internal service from disappearing from the trace record while a chatty front end takes the entire sample.
Diversity sampling guarantees a reference point per attribute set
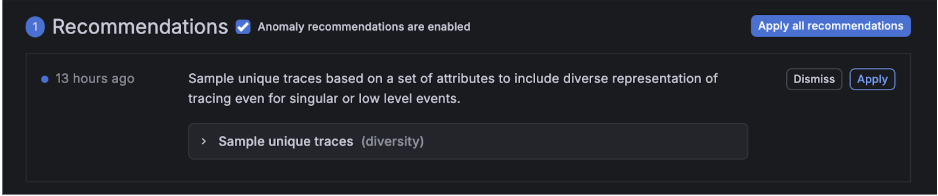
The second capability answers a different question. Volumetric sampling decides how much of each service survives. Diversity sampling decides that something always survives: every 15 minutes it stores a unique combination of attributes such as service, route and status codes. When a new service or code path appears, the record already contains a trace for it, without anyone writing sampling logic for the new arrival.
The two mechanisms govern different parts of trace retention. One protects against a service being crowded out. The other protects against a combination of attributes that nobody thought to allow for. Grafana presents both as ways to make trace retention more precise.
A dropped trace stays readable by ID for 24 hours
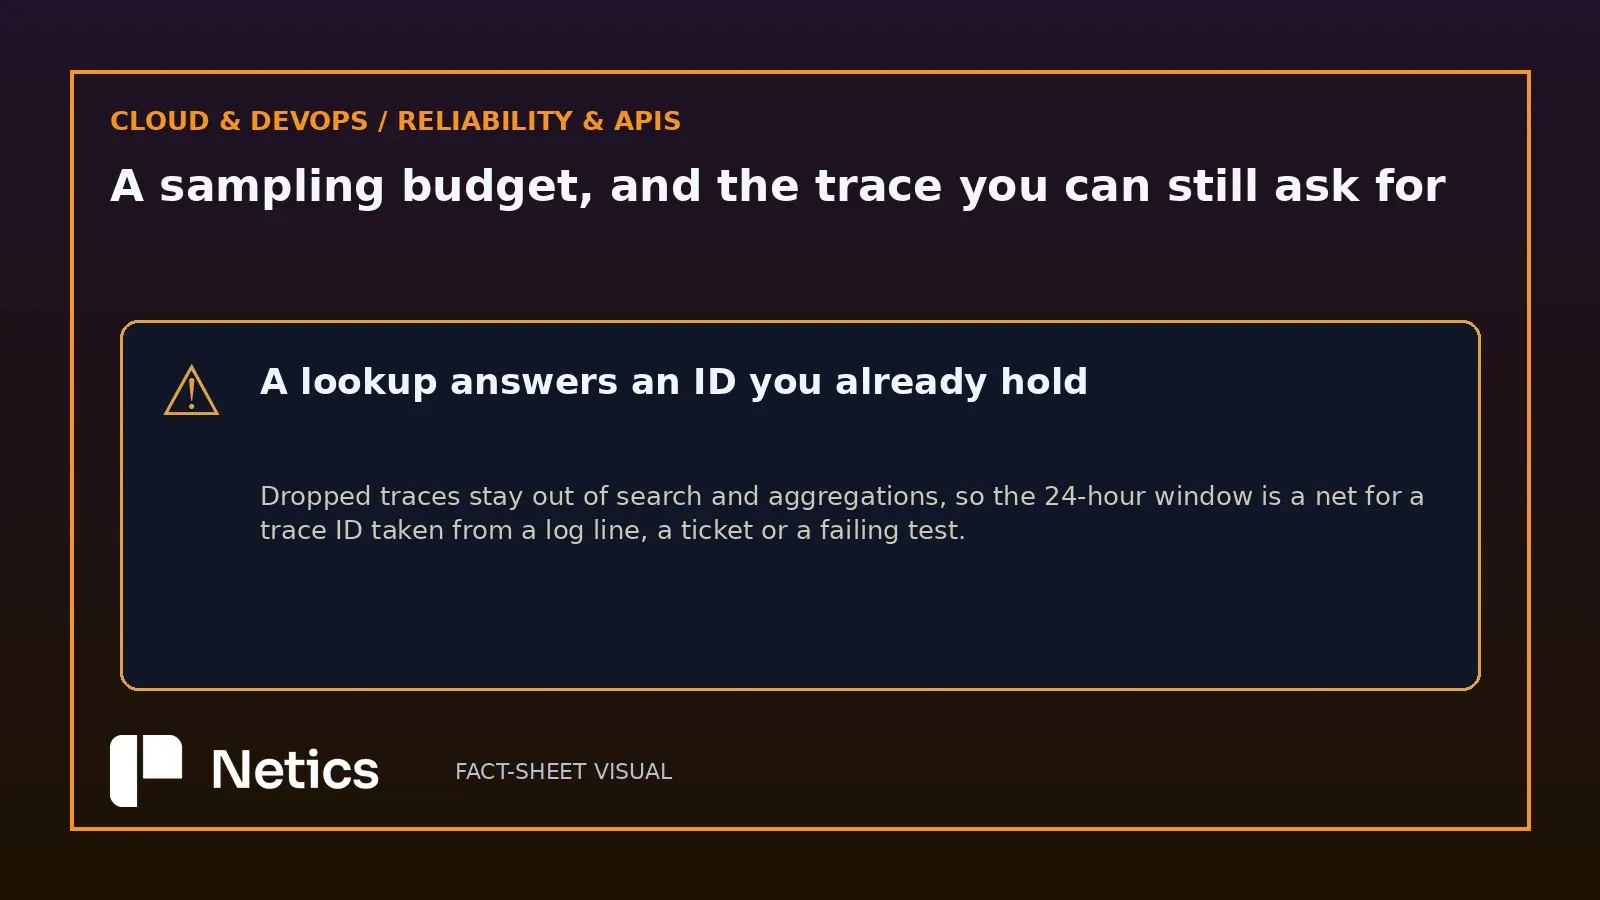
The third capability is the one that makes aggressive sampling defensible in a review. Adaptive Traces keeps every dropped trace queryable by trace ID for 24 hours after ingest. If a trace ID appears in a log line, a support ticket or a test failure, the trace can be retrieved even though the platform decided not to keep it.
The post gives the limit in the same breath: dropped traces stay outside search and aggregations, and retrieval requires a known trace ID; sampling policy determines which traces remain searchable. That sentence is the honest boundary of the feature, and it changes how the mechanism gets documented. A lookup by ID only works when the ID exists somewhere else, which means the log line or the ticket reference is part of the retention design.
Twenty-four hours is also a policy number, and it belongs next to the incident timeline. An issue found on Friday afternoon and investigated on Monday morning sits outside the window, and a team that expects the lookup to cover it will be disappointed by a system that behaved as documented.
Logs drop at the collector and archive into your own bucket
The log section repeats the pattern with a different mechanism. Adaptive Logs finds patterns nobody queries and trims them on the way in. Two additions move the cut earlier and make it reversible.
Fleet-managed Adaptive Logs applies the same drop rules and exemptions directly on the collectors a team already runs, through Fleet Management, so matching lines are filtered before they leave the environment; the post notes the saving on egress and network overhead on top of storage, and that Grafana creates and keeps the collector pipelines in sync. Archive routes logs to the customer's own low-cost object storage, where they remain available, and replay brings them back on demand for an investigation, an audit or a compliance request. Fleet-managed Adaptive Logs and Archive are in public preview, and replay is listed as coming soon.
The storage destination matters beyond the discount. Logs parked in a bucket the company owns stay reachable when the observability contract changes, which is the argument for keeping an archive path even when the ingest bill is comfortable.
Adaptive Metrics applies its own recommendations, with two modes
Metrics close the loop. Adaptive Metrics already looked at how metrics are used across dashboards, alerts, recording rules and queries, and recommended aggregating the ones nobody needs at full detail into lower-cardinality versions. The catch the post states plainly is that a human had to review each recommendation, and for a platform team that review becomes its own job.
Auto-apply removes the review step for a chosen segment: new recommendations are applied as they are generated, with exemptions for metrics that must never be touched. Two modes decide the trade-off. Cost-first mode only applies recommendations that do not grow the series count, and coverage-first mode applies every recommendation including the ones that add series to cover new metrics or dimensions. Auto-apply is generally available.
An automated cardinality change is a change to the data a dashboard reads, and the two modes are two different promises about what happens next. Cost-first guarantees that the series count does not increase. Coverage-first accepts a possible increase in cost to cover the new dimensions a team just instrumented. Choosing between them is a decision about which failure the company prefers, and the post is unusually clear that both are choices.
What value-based telemetry needs from a team
The framing that opens the post, costs that follow value, is a promise the product cannot keep alone. Value is defined by the people who page at three in the morning, and the controls only execute a definition someone else supplied.
The controls require operating decisions from the team. Write down which signals earn their place, so a coverage-first or cost-first mode reflects a decision a team made on purpose. Keep trace IDs where they can be found later, because a 24-hour lookup only works when the identifier leaves the sampling system. And treat the archive destination as part of the retention policy, with the same review as any other copy of production data.
None of that is exotic, and all of it sits with the team rather than the platform. For a small operations group, a practical record covers which services are sampled at what budget, which attributes define a reference trace, where trace IDs are logged, and which bucket holds the archive. That record ties the bill to a documented definition of value and gives every change to a sampling field an explicit basis. Managed monitoring belongs in the same conversation, and the DevOps pipelines and managed monitoring work is where those definitions usually get their first review.
Sources
- Break the link between data volume and your observability bill with Adaptive Telemetry, Grafana Labs, grafana.com, 2026-10-20
- ObservabilityCON 2026: A guide to all the announcements from Grafana Labs, Grafana Labs, grafana.com
Source: the Grafana Labs post of 20 October 2026 by JK Basra and Steven Dungan, read in full on 3 November 2026. The tail-sampling framing, the volumetric sampling behaviour and its 25% information-density measurement, the diversity sampling interval of 15 minutes, the 24-hour dropped-trace lookup and its exclusion from search and aggregations, the general availability list, the Adaptive Logs, Fleet-managed and Archive statuses, the auto-apply modes and both Rapid7 quotes come from that post. The operating recommendations are Netics analysis.