
Designing Alerts That Explain an Incident
An alert is a message that arrives on a phone, and design decides whether it explains an incident or adds to the noise. The burn-rate windows in Google's SRE Workbook and the grouping, inhib

TL;DR
- An alert is a message a monitoring system sends when a measurement crosses a threshold, and its worth shows up in the decision it lets someone take in the next ten minutes.
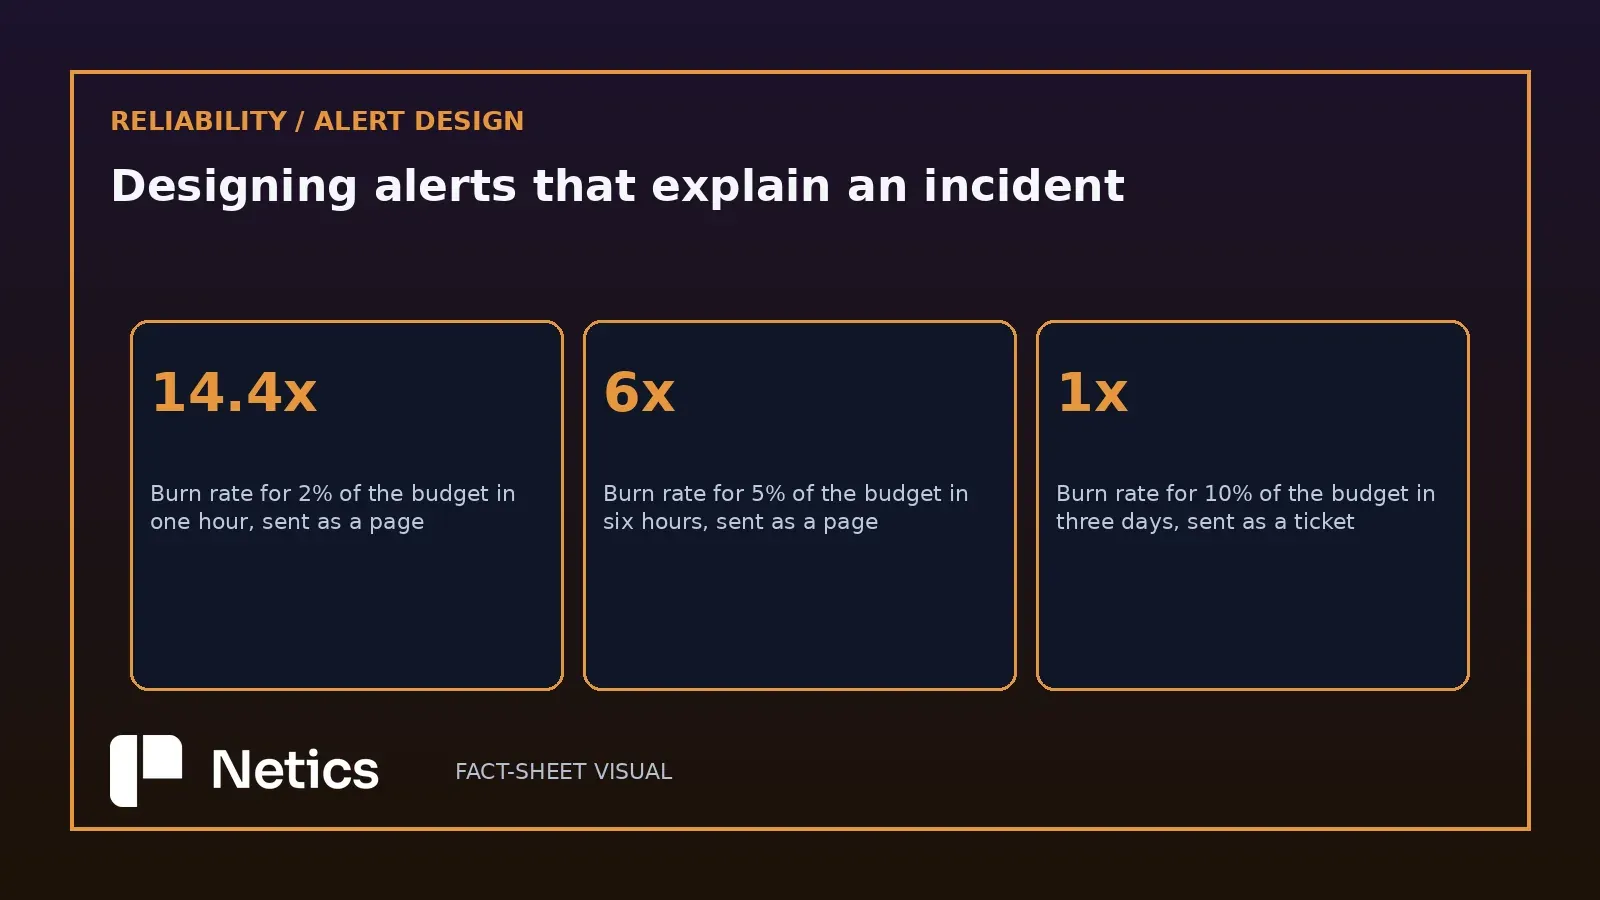
- Google's SRE Workbook recommends paging when a service burns 2% of its error budget in one hour, which is a burn rate of 14.4, and when it burns 5% in six hours; the same table sends 10% in three days to a ticket queue.
- The window you pick sets how many pages arrive, because a ten-minute window on a 99.9% objective fires on an event that consumes 0.02% of the monthly budget.
- Grouping, inhibition, silences and mute timings are the mechanisms that keep one broken dependency from turning into a hundred notifications.
- A page has to carry the symptom, the scope, the time window and the runbook, and it has to name the person on call.
- A starting configuration for a small team is one page-level threshold, one ticket-level threshold and a weekly review, and measuring whether the pages earn their keep means reading what actually fired.
What an alert has to carry
An alert is a message that reaches a phone at an inconvenient hour, and the reader has three questions: what a user is meeting right now, how much of the service is affected, and where the instructions live. A notification that answers those questions turns into work. One that reports a metric name turns into a search.
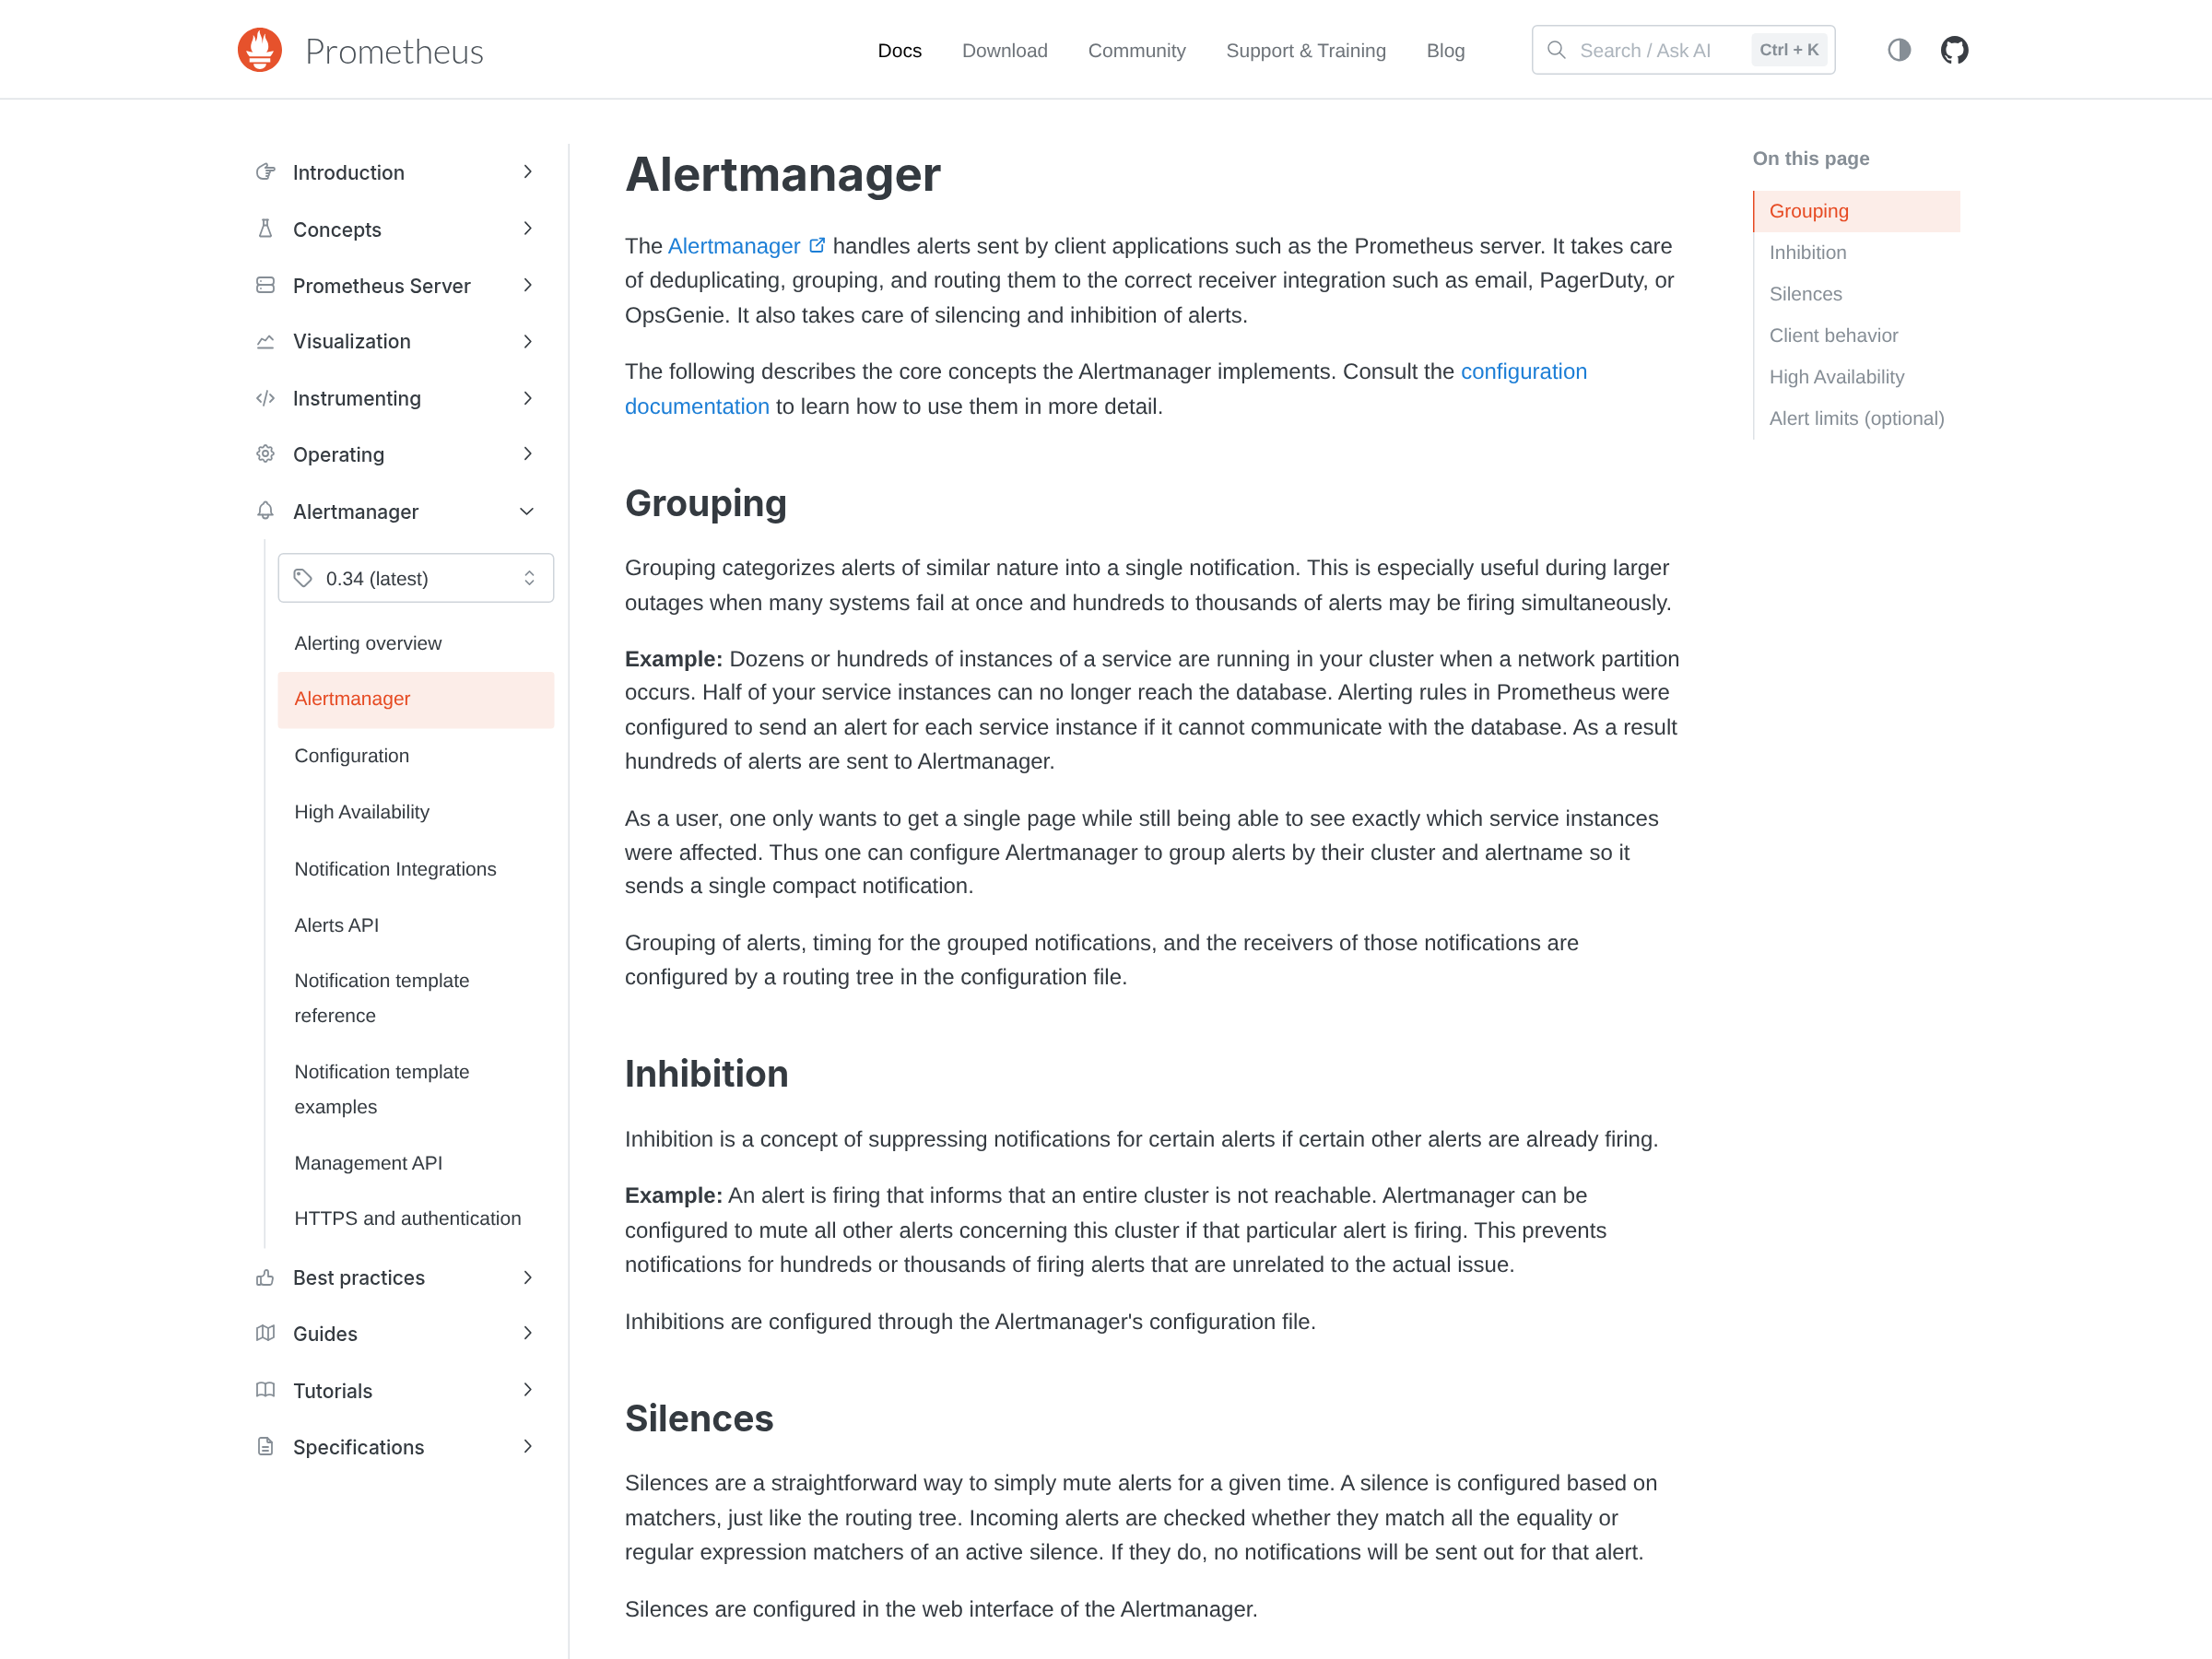
Prometheus' Alertmanager documentation describes what the component does with the alerts it receives: it deduplicates them, groups them and routes them to a receiver such as email, PagerDuty or OpsGenie. Deduplication and routing act on alerts that already exist, so the design decisions sit upstream in the alerting rules that decide when the system has something worth saying.
Take a marked hypothetical. Six people run an online shop with a checkout page, a payment provider and a nightly stock synchronisation job. A rule that pages whenever the payment provider's error counter crosses zero produces a page at every card decline, and a rule that pages when the checkout success ratio drops below the objective produces a page when customers cannot buy. The first rule describes a dependency. The second describes what the business is losing.
How the burn-rate window sets the number of pages
Window size has a large effect on page volume, and the SRE Workbook quantifies it. Its example starts with a ten-minute window on a 99.9% objective and shows the cost: a 0.1% error rate alerts while consuming 0.02% of the monthly error budget. Widen the window and precision improves, since the alert now requires a larger budget spend. What the authors recommend as a starting point is a burn-rate framing, in which the threshold describes how fast the service consumes its error budget relative to the objective.
The concrete numbers are worth memorising. Two percent of the 30-day budget spent in one hour equals a burn rate of 14.4, and five percent in six hours equals 6. Both belong in a paging path. Ten percent in three days equals a burn rate of 1, and the workbook places that one in a ticket queue, which suits a slow leak that a working day can absorb. Where an issue burns through the budget in hours, an active notification earns its interruption.
One refinement closes most of the remaining gap. A multiwindow alert checks a short window alongside the long one, with one twelfth of its duration as a working guideline, so the page stops firing shortly after the errors stop. The workbook's example pages when the burn rate exceeds 14.4 over both the previous hour and the previous five minutes. The same section adds a warning that pays for itself once real incidents arrive: overlapping windows describe the same incident, so suppression is needed to avoid three notifications from one fault.
Grouping and inhibition collapse a broken dependency into one notification
A broken dependency produces alerts in proportion to how many things depend on it, and the Alertmanager exists to flatten that arithmetic. Its grouping concept collects alerts of a similar nature into one notification, which the documentation presents for exactly this scenario: a network partition leaves half the service instances unable to reach their database, and hundreds of alerts leave the detection layer. Grouping them by cluster and alert name produces one compact message that still names the affected instances.
Inhibition works on the same problem from another angle. When an alert states that an entire cluster is unreachable, the Alertmanager can mute every other alert about that cluster for as long as the bigger one keeps firing. The suppression is declared once, in configuration, and it spares a responder the task of reading a hundred notifications that all describe the same outage.
There is a hard cap for the ugly case. Alertmanager can limit how many active alerts a single alert name may carry, dropping new ones once the limit is reached while still processing heartbeats from alerts it already knows, and it exposes a counter for everything it dropped. The documentation frames the feature as protection for the receivers. The use case it names is an unexpected number of instances of the same alert arriving at once.
Silences and mute timings cover planned work
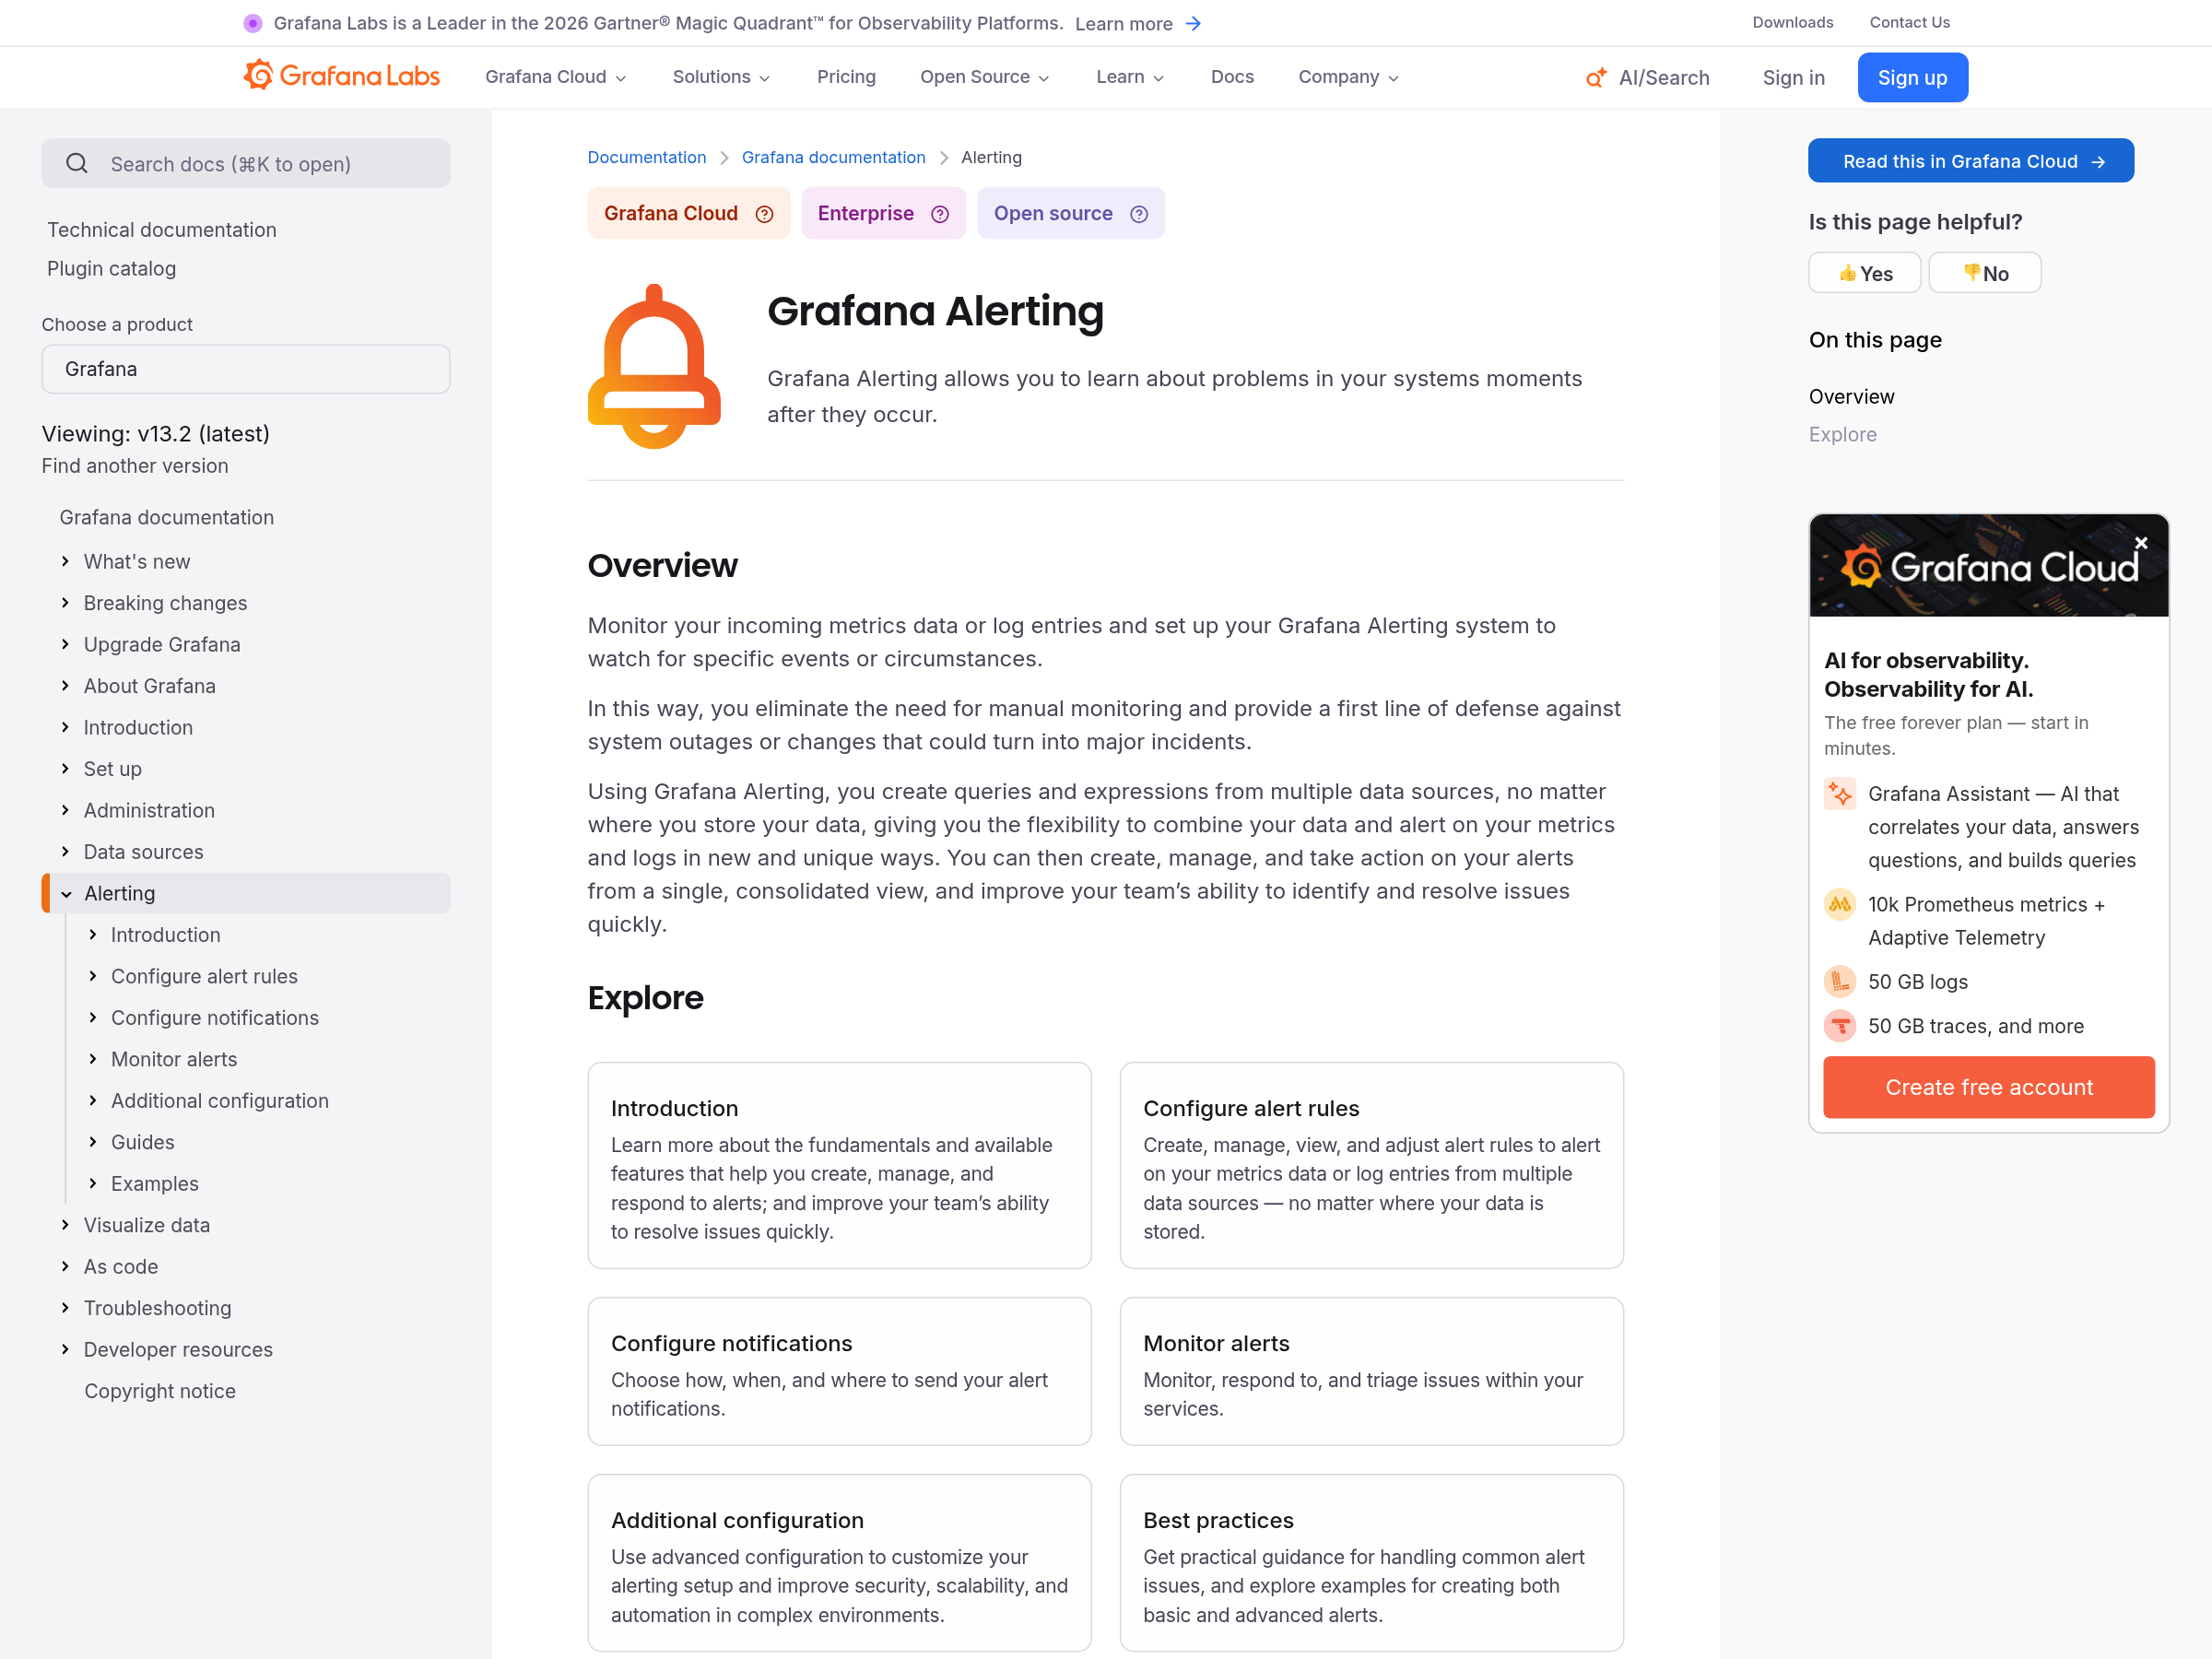
Silences mute alerts for a declared period, matched against the alert's own labels, and the Alertmanager configures them from its web interface. Grafana's alerting documentation separates the same family of controls: mute timings and active time intervals for recurring windows, silences for one-off maintenance, and inhibition rules for the case where a bigger alert already covers the situation.
The design question is who may create them. A silence that outlives its change window is a blind spot with a timestamp, so a team needs the two fields that make it auditable: the reason and the expiry. Grafana's documentation treats silence access as a permission of its own, separate from the right to edit rules.
The runbook the responder opens at 03:00
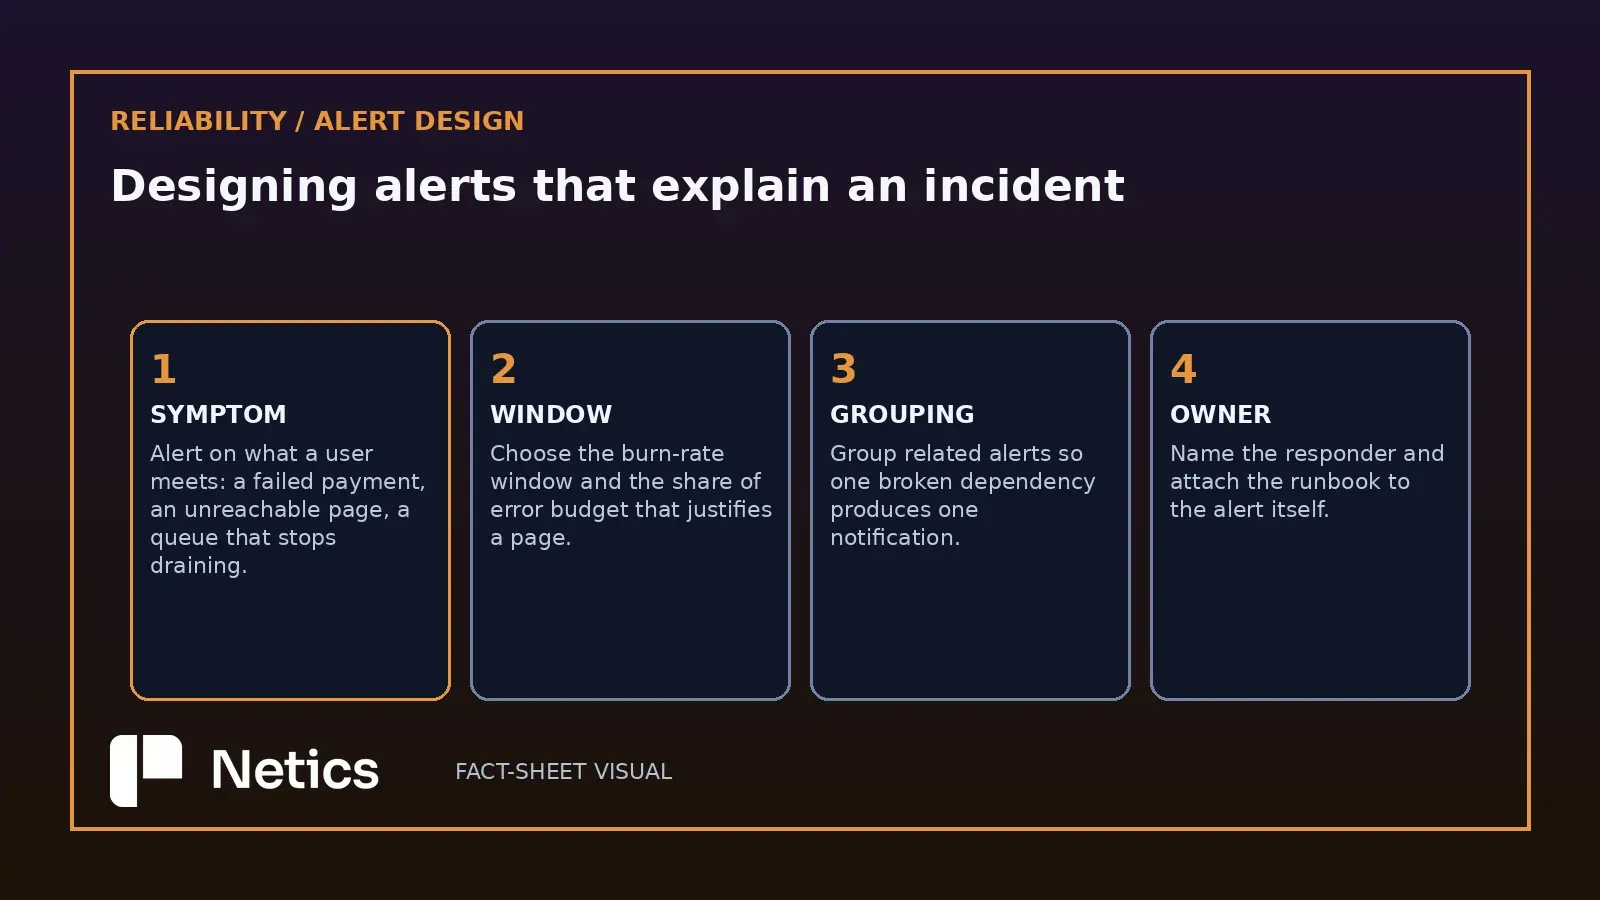
A page that explains itself starts with four fields: the symptom in user terms, the scope in numbers, the window the measurement covers, and a link to the instructions. The first three come from the alert payload. The fourth comes from discipline, because a runbook link that points at an empty page is worse than none at all.
The owner is the fifth field. An alert carries meaning for the team that can act on it and noise for everyone else, so the routing decision belongs to the rule that creates it. The Alertmanager's routing tree keeps that ownership in configuration, which survives a staff change.
A useful test costs nothing: open the runbook for the three alerts that fired most often last month and read them as the person who was asleep. Where the text starts with a metric name, the alert is not finished.
A starting configuration for a small team
Four decisions cover most of what a small team meets. Pick one objective per user-facing journey, such as checkout success or job completion within an hour. Write two alert rules against it, one at the 14.4 burn-rate threshold for the paging path and one at the 1 threshold for a ticket. Route the 14.4 rule to the on-call path and the 1 rule to a ticket queue, group both by service, and set the per-alert-name limit so a single fault cannot flood the on-call channel. Name the person on call for the coming week and put the runbook link in the alert annotation.
This first version deliberately defers the workbook's second paging tier, a burn rate of 6 over six hours, to keep the configuration small, and that tier joins the paging path once the two rules are in place; until then, a burn rate below 14.4 pages nobody.
Measuring whether the pages earn their keep
The numbers that matter sit in the firing history. Count how many pages arrived last month, how many led to an action, and how many were closed as noise. A page that never leads to work is a candidate for demotion to a ticket, and a ticket alert that repeatedly turns into an outage is a candidate for promotion.
Keep the review weekly and short. Read the three most frequent alerts, check their windows against the burn-rate table, and confirm the runbooks still describe the current architecture. Without this step, the silence list grows and trust in the channel shrinks, which is the expensive version of the same problem.
The Netics approach to infrastructure monitoring with plain-language alerts summarises each alert with the likely cause and the first steps, filters out the noise, and runs runbook actions prepared in advance only when you approve them.
If you want a second opinion on where those thresholds should sit for your services, book a free 30-minute audit and bring last month's firing history. The audit starts from that list to decide which pages stay.
Sources
Source: Alerting on SLOs — sre.google/workbook/alerting-on-slos, Google SRE Workbook chapter 5, retrieved 2026-10-14 (a ten-minute window on a 99.9% objective fires on a 0.1% error rate consuming 0.02% of the monthly error budget; a duration parameter gives a 100% outage the same detection time as a 0.2% outage, with the 100% outage consuming 140% of the 30-day budget in one hour; burn rate defined as how fast a service consumes its error budget relative to the SLO; recommended starting numbers of 2% budget consumption in one hour and 5% in six hours for paging and 10% in three days for ticket alerts, corresponding to burn rates of 14.4, 6 and 1; multiwindow alerts using a short window with one twelfth the duration of the long window, with a page when the 14.4x rate holds over both one hour and five minutes; suppression needed to prevent three notifications from overlapping windows).
Source: Alertmanager — prometheus.io/docs/alerting/latest/alertmanager, Prometheus documentation, retrieved 2026-10-14 (the Alertmanager handles alerts sent by client applications such as the Prometheus server, deduplicating, grouping and routing them to a receiver integration such as email, PagerDuty or OpsGenie, and handling silencing and inhibition; grouping categorizes alerts of similar nature into a single notification and matters when hundreds to thousands of alerts fire at once, configured through a routing tree; inhibition suppresses notifications for certain alerts when other alerts are already firing, muting alerts about a cluster while an alert that the whole cluster is unreachable fires; silences mute alerts for a given time based on matchers set in the web interface; the optional per-alertname limit drops new alerts once the limit is reached, processes heartbeats from known alerts, expires fingerprints to make room and exposes the alertmanager_alerts_limited_total metric).
Source: Grafana Alerting — grafana.com/docs/grafana/latest/alerting, Grafana documentation, retrieved 2026-10-14 (alerting covers contact points, notification policies, mute timings and active time intervals, silences, inhibition rules, template notifications, alert state and notification history, roles and permissions including separate silence access, high availability configuration and meta monitoring, with best-practice guides on handling connectivity errors, handling missing data and the case where SLOs reduce alert noise).
Figures: official documentation captures from Prometheus, Grafana and Google, plus two Netics editorial diagrams.