
NVIDIA Launches Minerva and Measures Observability in Factory Yield
NVIDIA launched Minerva on 22 October 2026, an AIOps platform that reads telemetry from GPUs, Spectrum-X switches, SuperNICs, DPUs, Slurm and Run:ai, and reports on AI factory yield measured

TL;DR
- NVIDIA Minerva is an AIOps platform NVIDIA launched on 22 October 2026 to collect telemetry from an AI factory and turn it into incident intelligence, and an AI factory is the building full of GPUs that trains and serves models.
- Minerva ingests telemetry from GPUs, NVLink switches, Spectrum-X Ethernet switches, SuperNICs, DPUs, the NCCL library, schedulers including Slurm and Run:ai, and the workloads themselves.
- It reports on yield, a measure of useful work through GPU hours, goodput, cluster uptime and token production, which, in our reading, can give an infrastructure number a business owner who already holds the capacity budget.
- Topology-aware correlation turns an alert storm into one incident: a network fault that cascades across hundreds of components can generate thousands of alerts, and the platform consolidates related events with a likely root cause.
- The knowledge graph that enables this maps GPUs, switches, cables and jobs, so it inherits the labels your scheduler and your naming conventions already emit.
- A cluster with no baseline has nothing for the anomaly detection to compare against during a learning period NVIDIA does not state, and the three consumption tiers mean a small operator can start with the collector and keep an existing dashboard estate.
NVIDIA shipped the announcement and the product page on the same day, and the two documents describe different things. The post is about a launch and a customer, and its stated results (longer time between interruptions, faster time to repair, greater insight) come with no figures. The product page is about an architecture, and it is the one worth reading, because it says where the data comes from and what the platform does with it.
What Minerva ingests from an AI factory
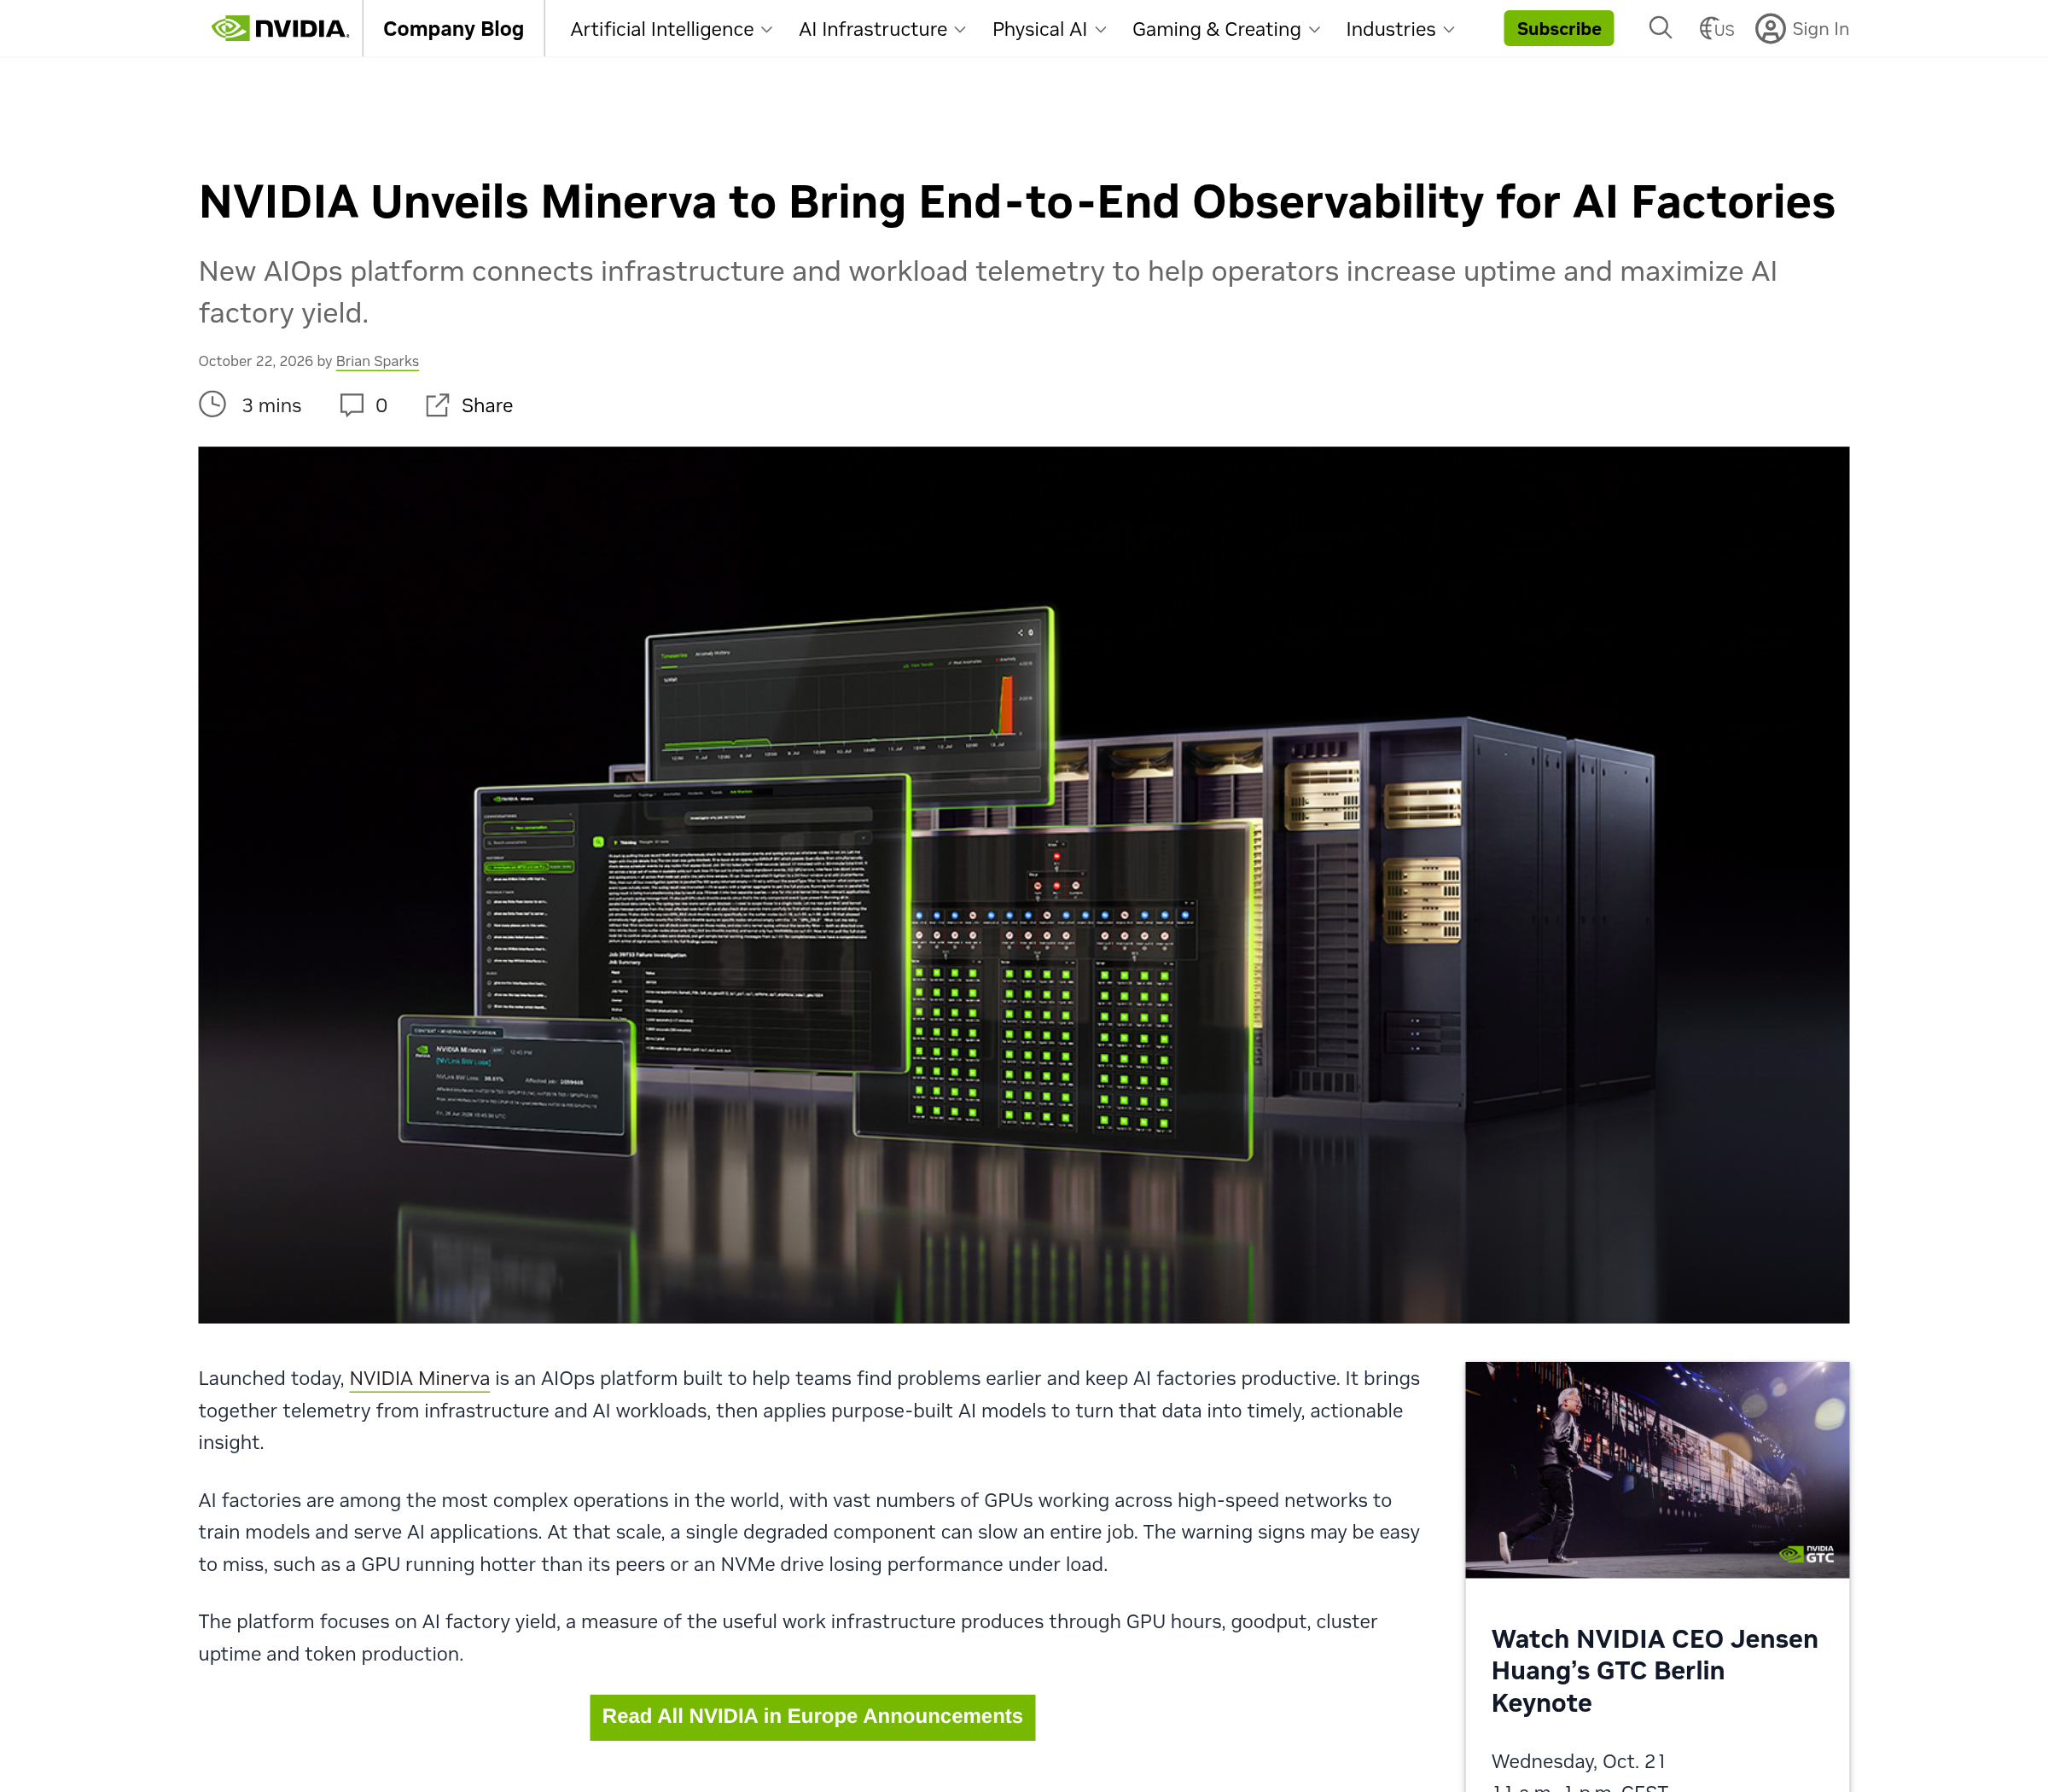
The collector reads telemetry from NVIDIA GPUs, NVLink switches, Spectrum-X Ethernet switches, SuperNICs and DPUs. It also reads the NVIDIA Collective Communications Library, schedulers including Slurm and NVIDIA Run:ai, and the AI workloads themselves. NVIDIA places the collector in DSX OS and the wider platform in the DGX OS stack, and offers a view from GPU to grid by correlating facility-level signals with the compute data.
That list is a statement about scope. NVIDIA's post says traditional monitoring tools often divide the data center into separate views, with networking, compute, site reliability and machine learning teams each seeing a different part of the operation. Minerva's claim is that the correlation happens on data from all four, which matters because the failure modes NVIDIA names in the post cross those boundaries: a GPU running hotter than its peers, an NVMe drive losing performance under load.
Yield gives an infrastructure number a business owner
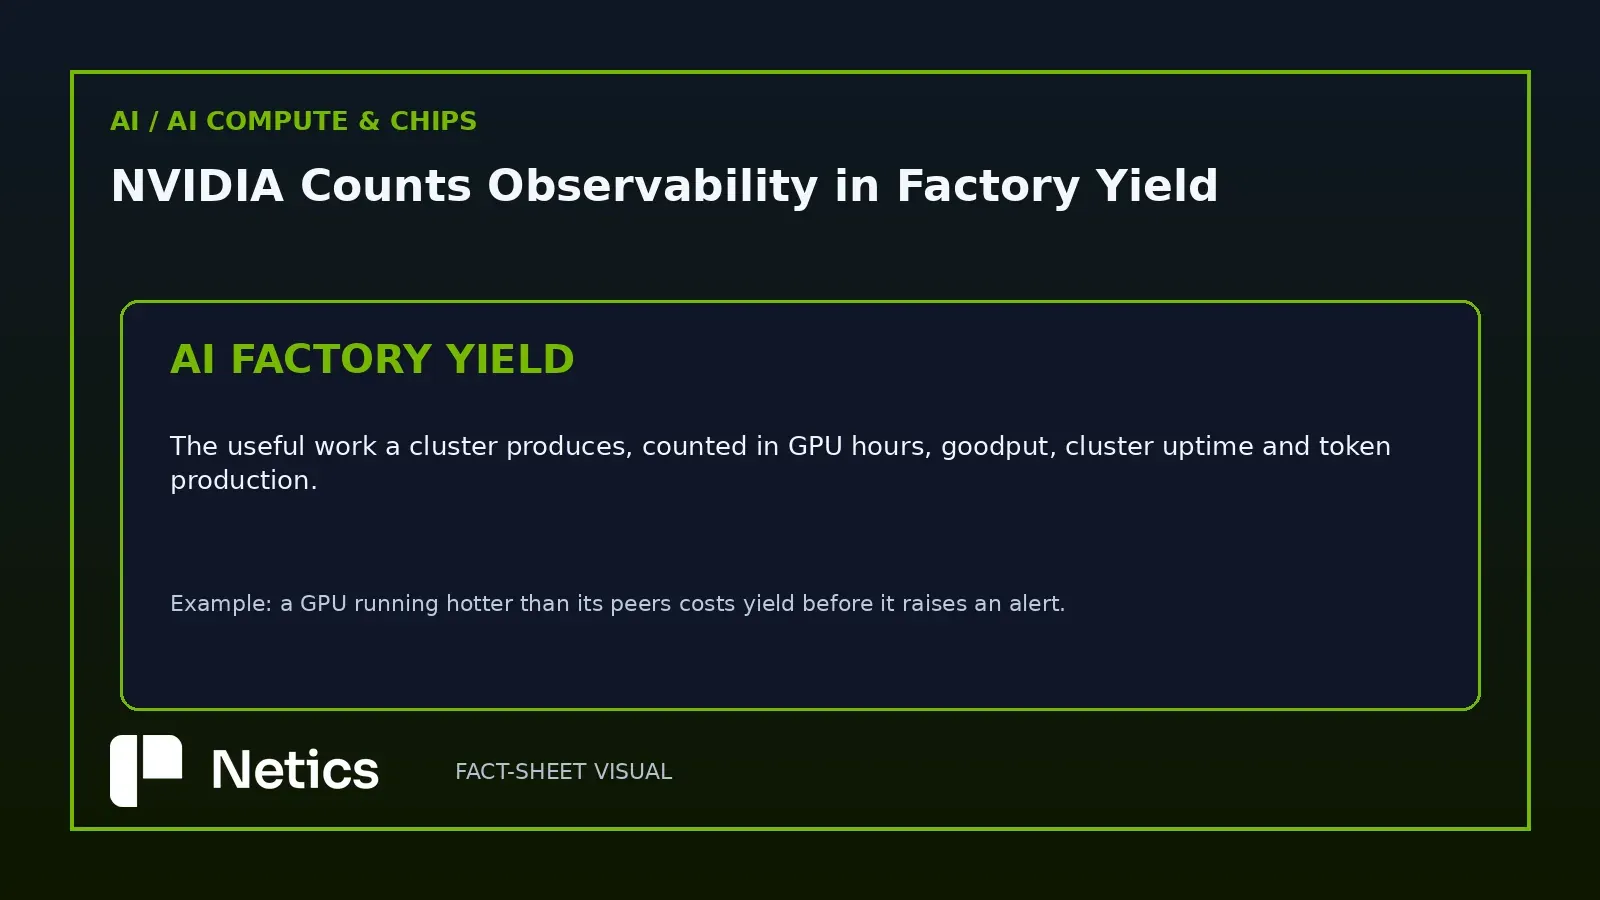
Yield is defined on four components: GPU hours, goodput, cluster uptime and token production. The product page puts it as protecting GPU hours, cluster uptime and token production to maximise the metric, and the announcement repeats the same four terms.
The accounting effect is the part worth noticing. A cluster that loses a job to a degraded switch port has always had an infrastructure cost, and the cost used to land in an availability report. Our reading is that, expressed as yield, the same event lands in the same unit as revenue per GPU hour and tokens served, which can change who reads the dashboard. Capacity planning, finance and platform engineering could then work from one shared number.
Topology correlation turns an alert storm into one incident
The product page is direct about the problem: a network issue that cascades across hundreds of components may generate thousands of alerts. Topology-aware correlation maps the dependencies between those components and consolidates related events into a single contextualised incident with a likely root cause, delivered into Slack or ServiceNow.
That is the same argument the alert design pillar on this blog makes for ordinary infrastructure, applied at GPU scale. The difference is mechanical: correlating across a fabric requires knowing which switch port a GPU's traffic crossed, which needs telemetry that names ports consistently and a model of the wiring.
A knowledge graph inherits the labels it is given
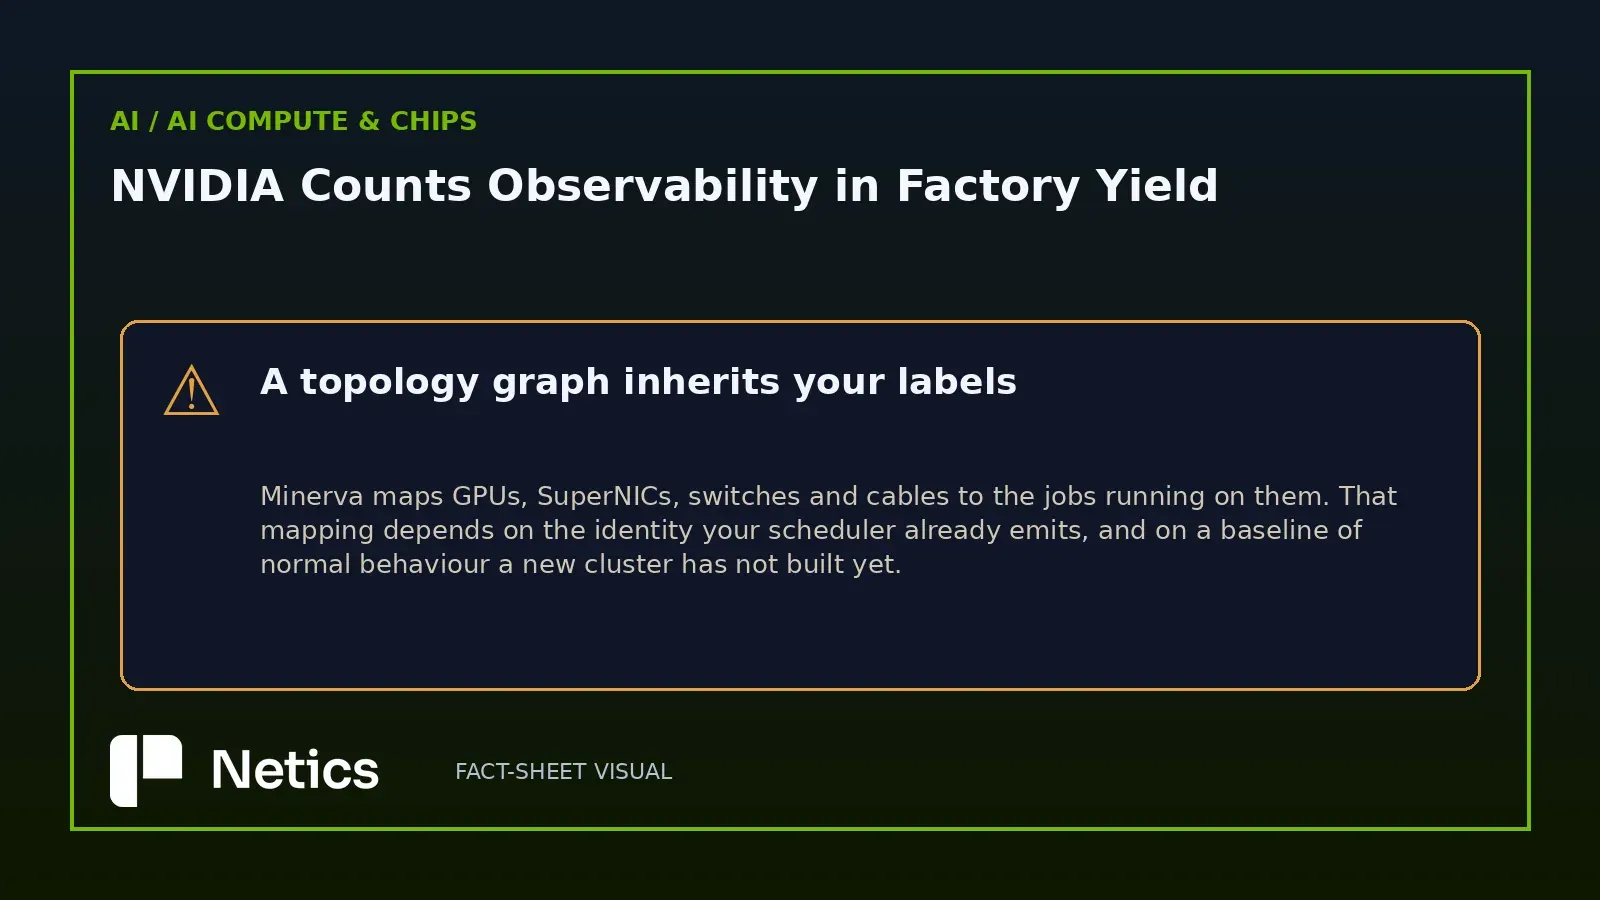
The knowledge graph is the product's core claim. It maps GPUs, SuperNICs, switches and cables, plus the jobs running on them, and the stated purpose is to trace a slow training job to the component affecting it across hundreds of thousands of GPUs.
The job-to-component edge comes from the scheduler, and that edge depends on labels a customer's platform team controls: job names, node names, queue names, and the mapping from a pod or a Slurm job to the GPU UUIDs it holds. A platform that predicts failures on topology inherits whatever discipline exists in those labels, which is the same root cause behind every configuration management database that went stale.
What a new cluster has no baseline for
The platform learns normal behaviour with supervised and unsupervised machine learning, then detects previously unseen anomalies and predicts emerging failures. Learning normal behaviour takes history, and a newly commissioned cluster may have seen only one workload shape.
Every operator who has tuned a threshold knows the sequence: a new environment produces false positives until the baseline absorbs a full cycle of job patterns. The product page does not state a learning window, and the announcement does not either. In our view, that makes the unstated learning period the one to plan for, with a review step on predicted failures before the predictions enter a maintenance queue.
Three ways to buy it, and what a small operator can copy
The product page lists three configurations: a collector that feeds existing observability tools such as Grafana, a collector plus the AI and machine learning insights feeding external tools such as OpenClaw and Claude, and the complete platform with the built-in assistant.
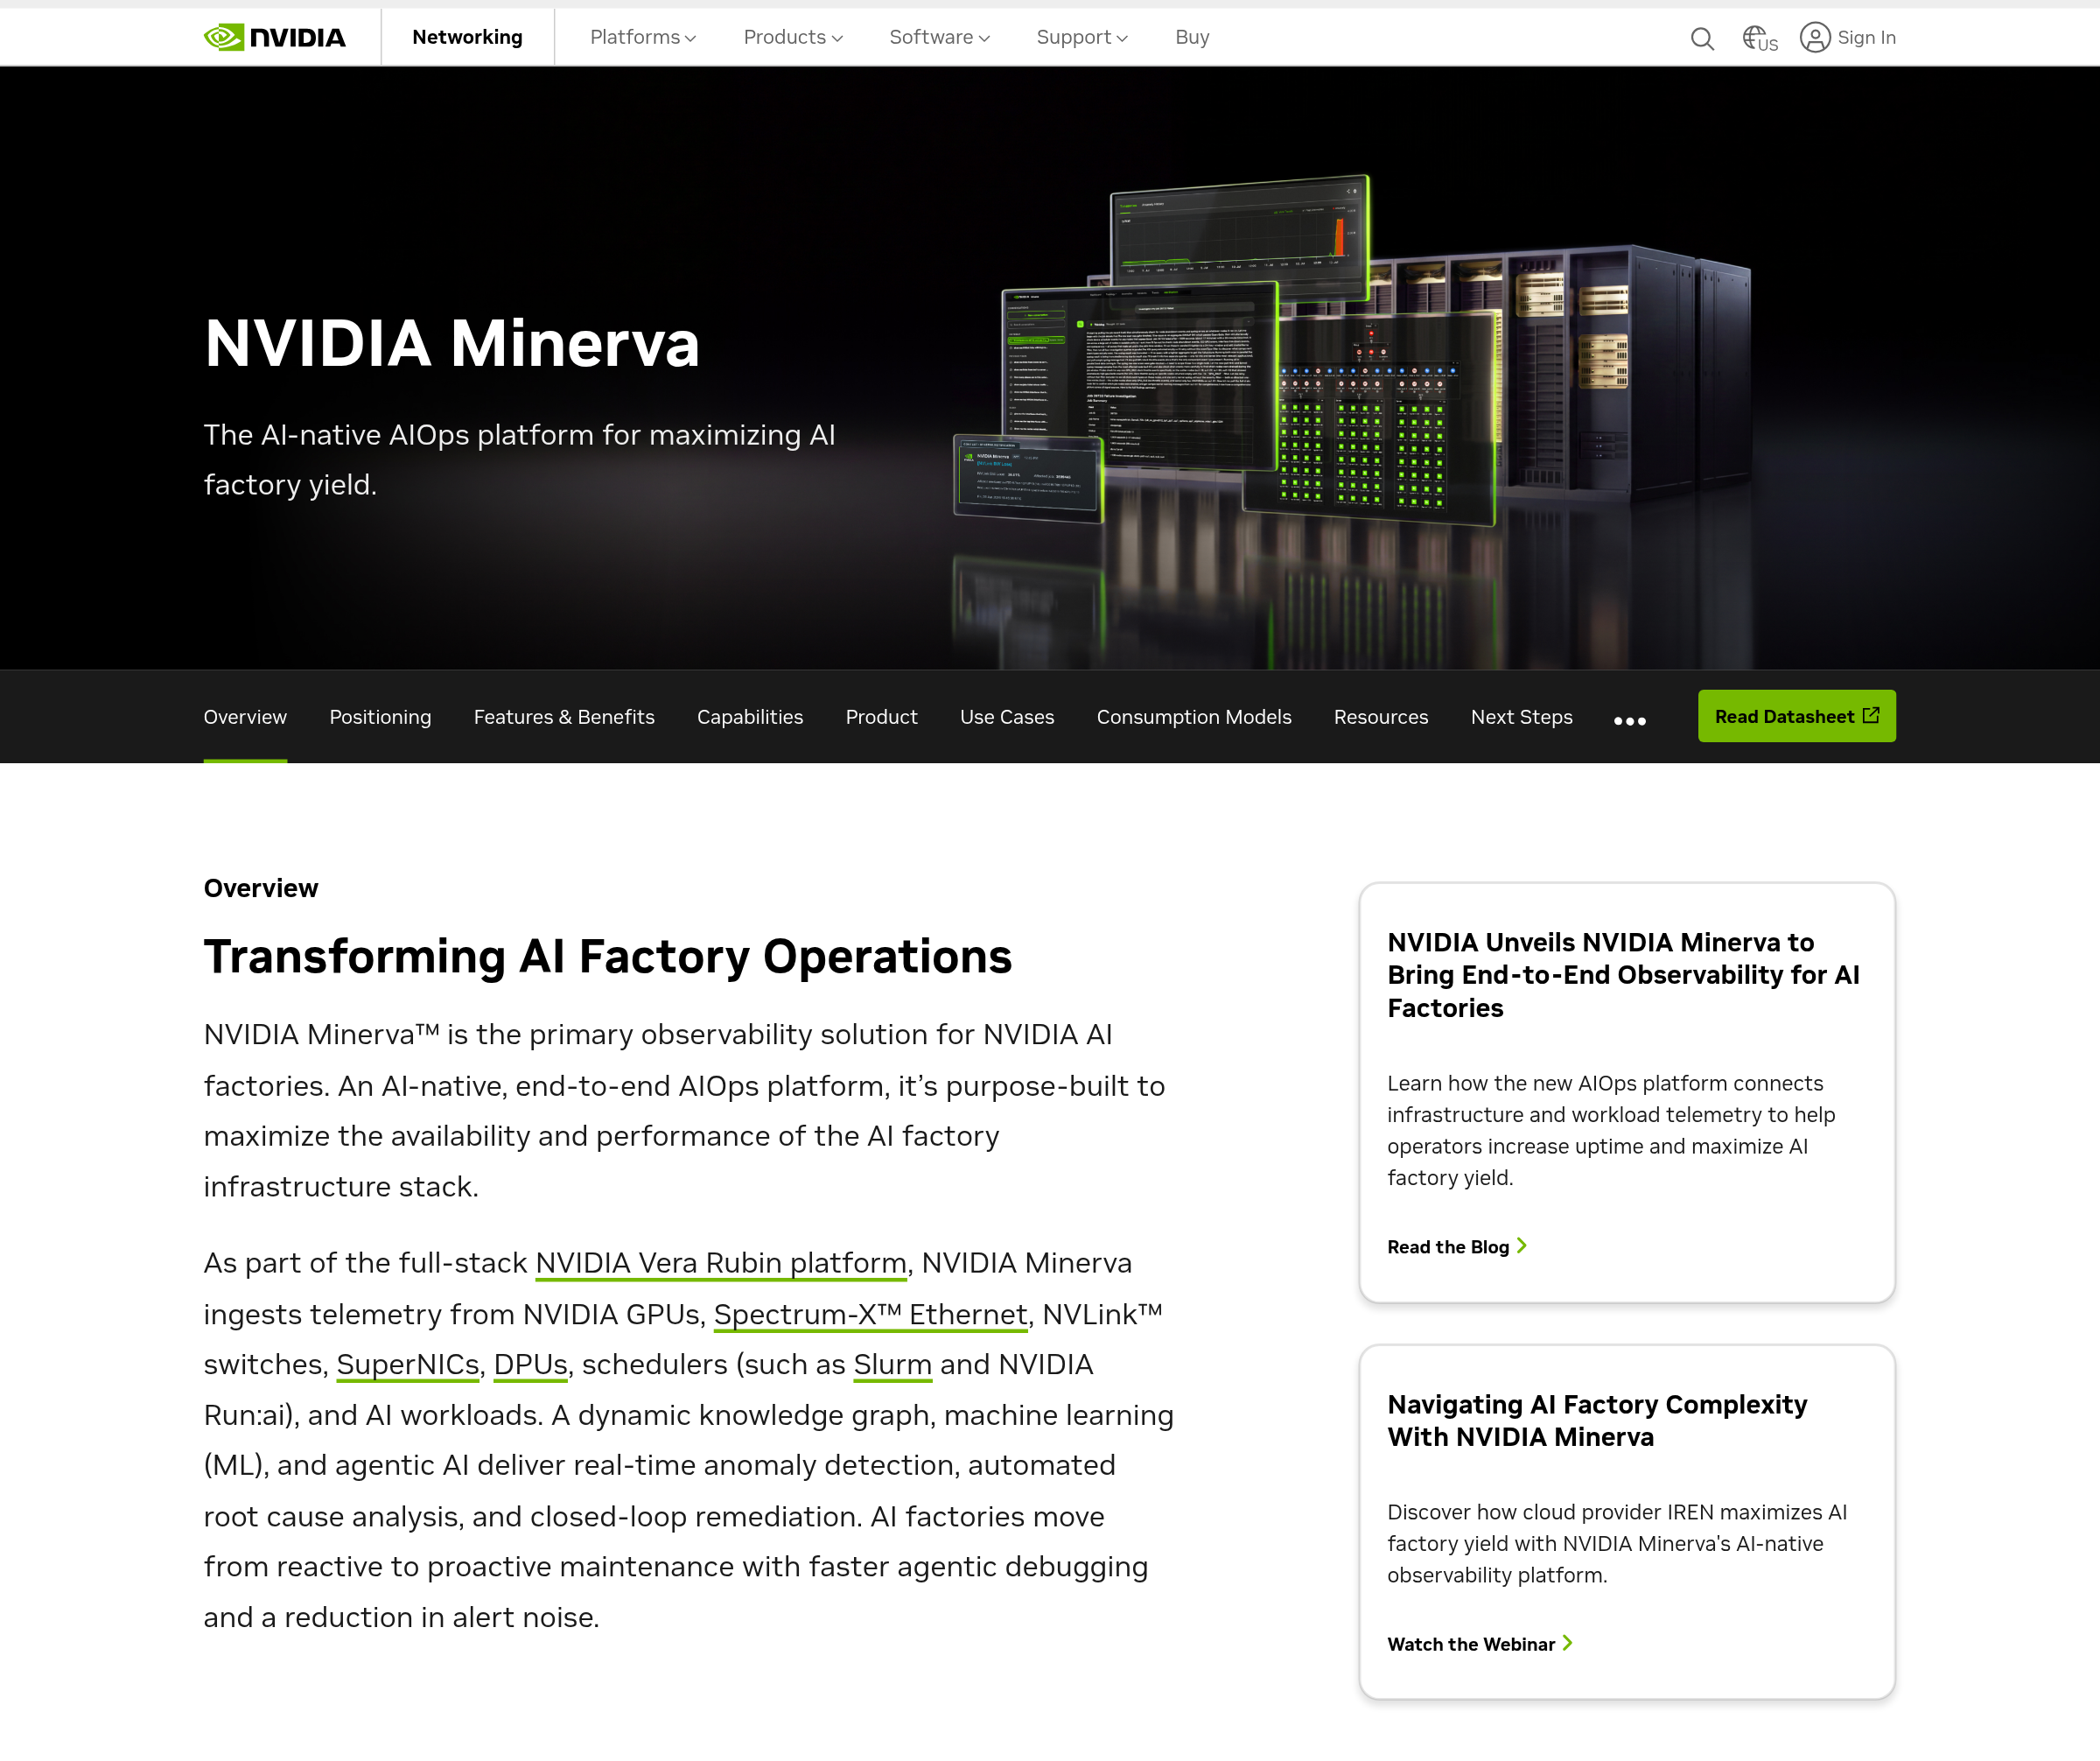
The tiers are the realistic entry point for most teams, and the pattern inside them is the part that transfers to a fleet of thirty-two GPUs that will never run this product. Three moves copy it: name every GPU, port and job consistently so correlation has something to join on; treat a burst of alerts as one event with a topology, which the monitoring work Netics does with small teams treats as the first design decision; and keep a written record of what normal looked like last month, because that record is the baseline any prediction depends on.
Sources
Source: NVIDIA Unveils Minerva to Bring End-to-End Observability for AI Factories — NVIDIA Blog, blogs.nvidia.com/blog/minerva-platform-infrastructure/, 22 October 2026, retrieved 2026-10-22 (Minerva as an AIOps platform launched that day, bringing together telemetry from infrastructure and AI workloads and applying purpose-built AI models; AI factories with vast numbers of GPUs where a single degraded component can slow an entire job and warning signs such as a GPU running hotter than its peers or an NVMe drive losing performance under load are easy to miss; the focus on AI factory yield measured through GPU hours, goodput, cluster uptime and token production; the division of the data center into separate networking, compute, site reliability and machine learning views and the connection of signals across GPUs, networking, storage, schedulers and workloads; the dynamic knowledge graph mapping GPUs, SuperNICs, switches, cables and jobs to trace a slow training job to the component affecting it across hundreds of thousands of GPUs; billions of data points per hour analysed with supervised and unsupervised machine learning to learn normal behavior, detect previously unseen anomalies, predict emerging failures and correlate events by topology, grouping an event storm into a focused incident with a likely root cause; the native AI assistant and external agentic AI tool connections, the person in the loop or the connection to automation through infrastructure APIs; the stated results of longer time between interruptions, faster time to repair and greater insight; IREN as a partner using Minerva, Aolani, Bitdeer AI, IBM, Jio, Lambda, Quake AI and Tesla planning to deploy it, and Dell Technologies, Lenovo and Supermicro offering it in AI factory operations portfolios; the quotation from Denis Skrinnikoff, chief technology officer of IREN, on maximizing the productivity of the company's GPUs).
Source: NVIDIA Minerva product page — NVIDIA, nvidia.com/en-us/networking/products/software/minerva/, retrieved 2026-10-22 (the AI-native AIOps platform for maximizing AI factory yield and the primary observability solution for NVIDIA AI factories; telemetry ingested from NVIDIA GPUs, NVLink switches, Spectrum-X Ethernet switches, SuperNICs, DPUs, the NVIDIA Collective Communications Library, schedulers including Slurm and NVIDIA Run:ai, and AI workloads; the dynamic knowledge graph, machine learning and agentic AI delivering real-time anomaly detection, automated root cause analysis and closed-loop remediation; the Minerva Collector as part of NVIDIA DSX OS with a single view from GPU to grid and facility-level signals; NVIDIA Sherlock as the multi-agent AI factory assistant and the Model Context Protocol server for integration with customer agents; open APIs, modular capabilities, Grafana integration, on-premises or software-as-a-service deployment, scaling to hundreds of thousands of GPUs and data sovereignty; the statement that a network issue cascading across hundreds of components may generate thousands of alerts and that topology-aware correlation consolidates related events into a single contextualized incident delivered through Slack or ServiceNow; dashboards and alerts purpose-built for Spectrum-X Ethernet networks, NVLink scale-up fabric, hardware health and services, aligned with NVIDIA reference architectures; the three configurations from collector to complete platform).
Source: NVIDIA's Minerva announcement post and the Minerva product page, both retrieved 2026-10-22 — every product name, metric, partner and figure above traces to one of those two pages. Images are captures of both pages plus two Netics editorial diagrams. Netics designs monitoring and alert correlation for small teams through Sentinel.