
Cloudflare Counts 18.2 Million DDoS Attacks in Q3 2026, and 96% Ended Under Ten Minutes
Cloudflare's 26th DDoS Threat Report counts 18.2 million network-layer attacks in Q3 2026, 8,226 an hour, with UDP floods at 31.31% of the mix and 251 attacks above 1 Tbps.

TL;DR
- A distributed denial-of-service attack is a flood of traffic from many machines at once, aimed at exhausting a service's bandwidth, its connection table or its CPU until ordinary users stop getting answers.
- Cloudflare published the 26th edition of its DDoS Threat Report on 29 October 2026, covering July, August and September 2026 across its own network.
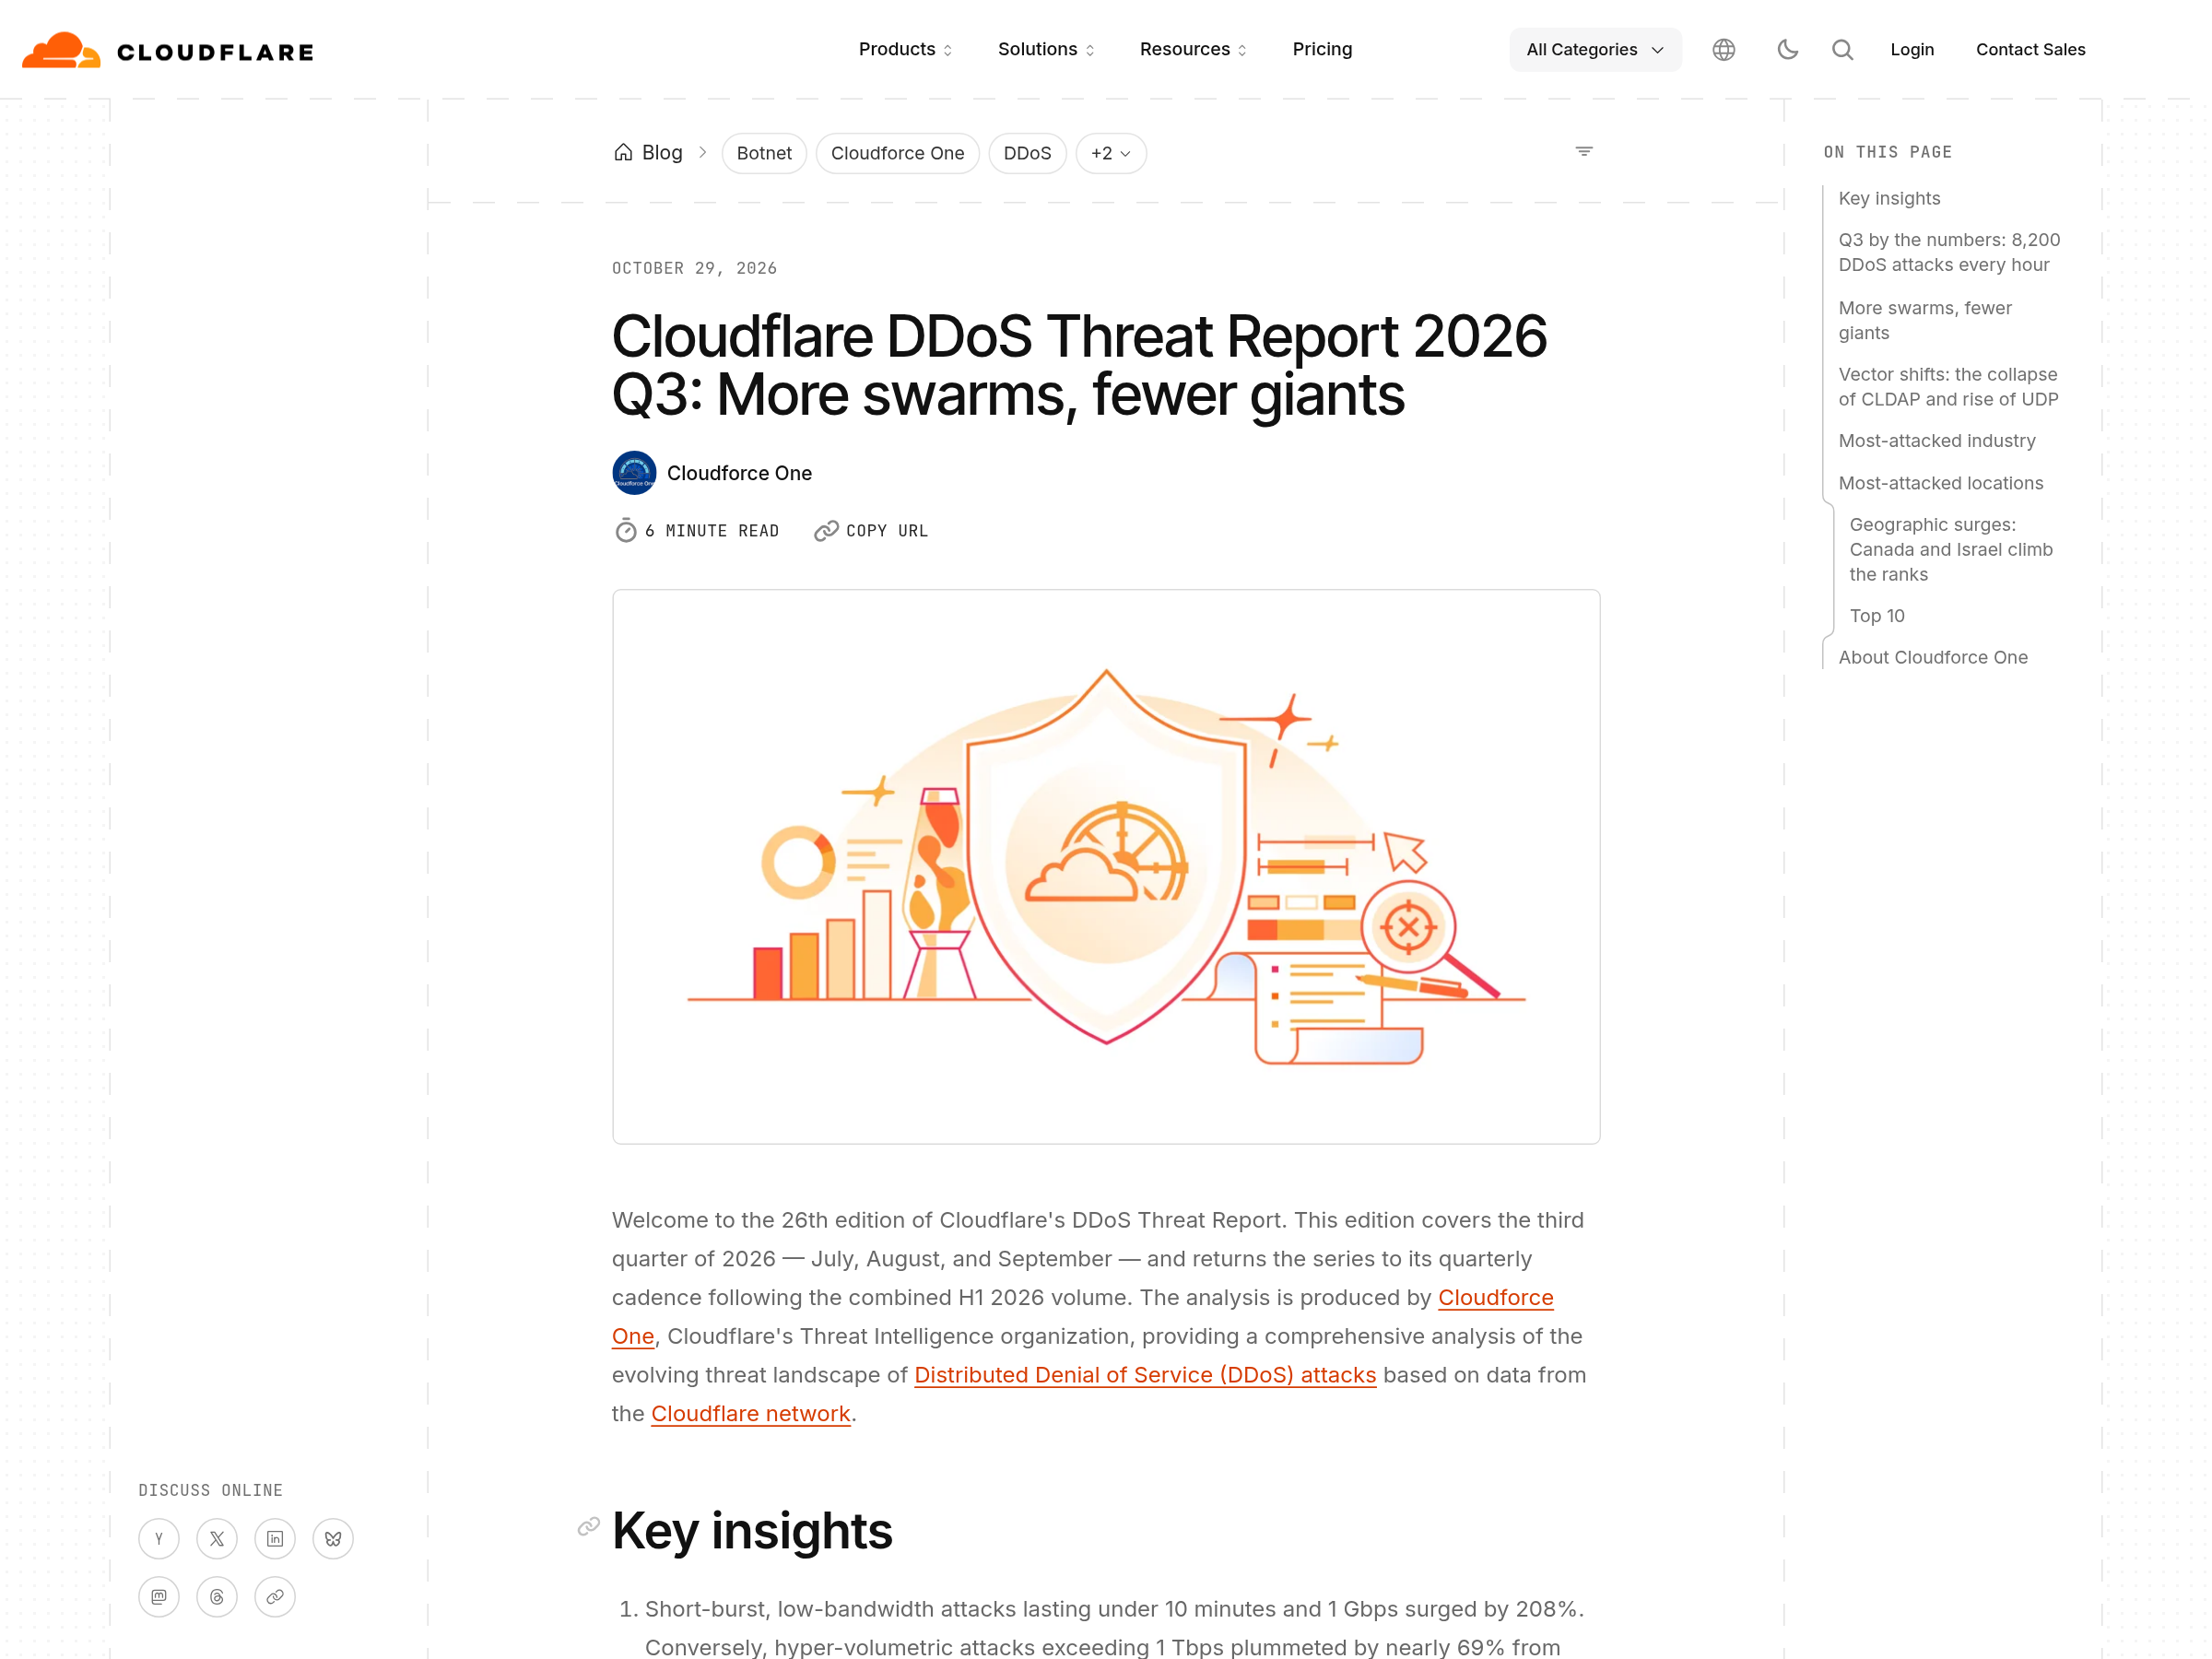
- The quarter carried 18.2 million network-layer attacks and 14.4 trillion HTTP DDoS requests, which works out at 8,226 network-layer attacks an hour, one every 0.44 seconds.
- Short-burst attacks under ten minutes and under 1 Gbps grew 208% year over year: 96% of network-layer attacks ended inside ten minutes, and 98% stayed under 1 Gbps.
- Attacks above 1 Tbps fell to 251 from 805 in Q2, a movement that follows law enforcement takedowns of four IoT botnets earlier in 2026.
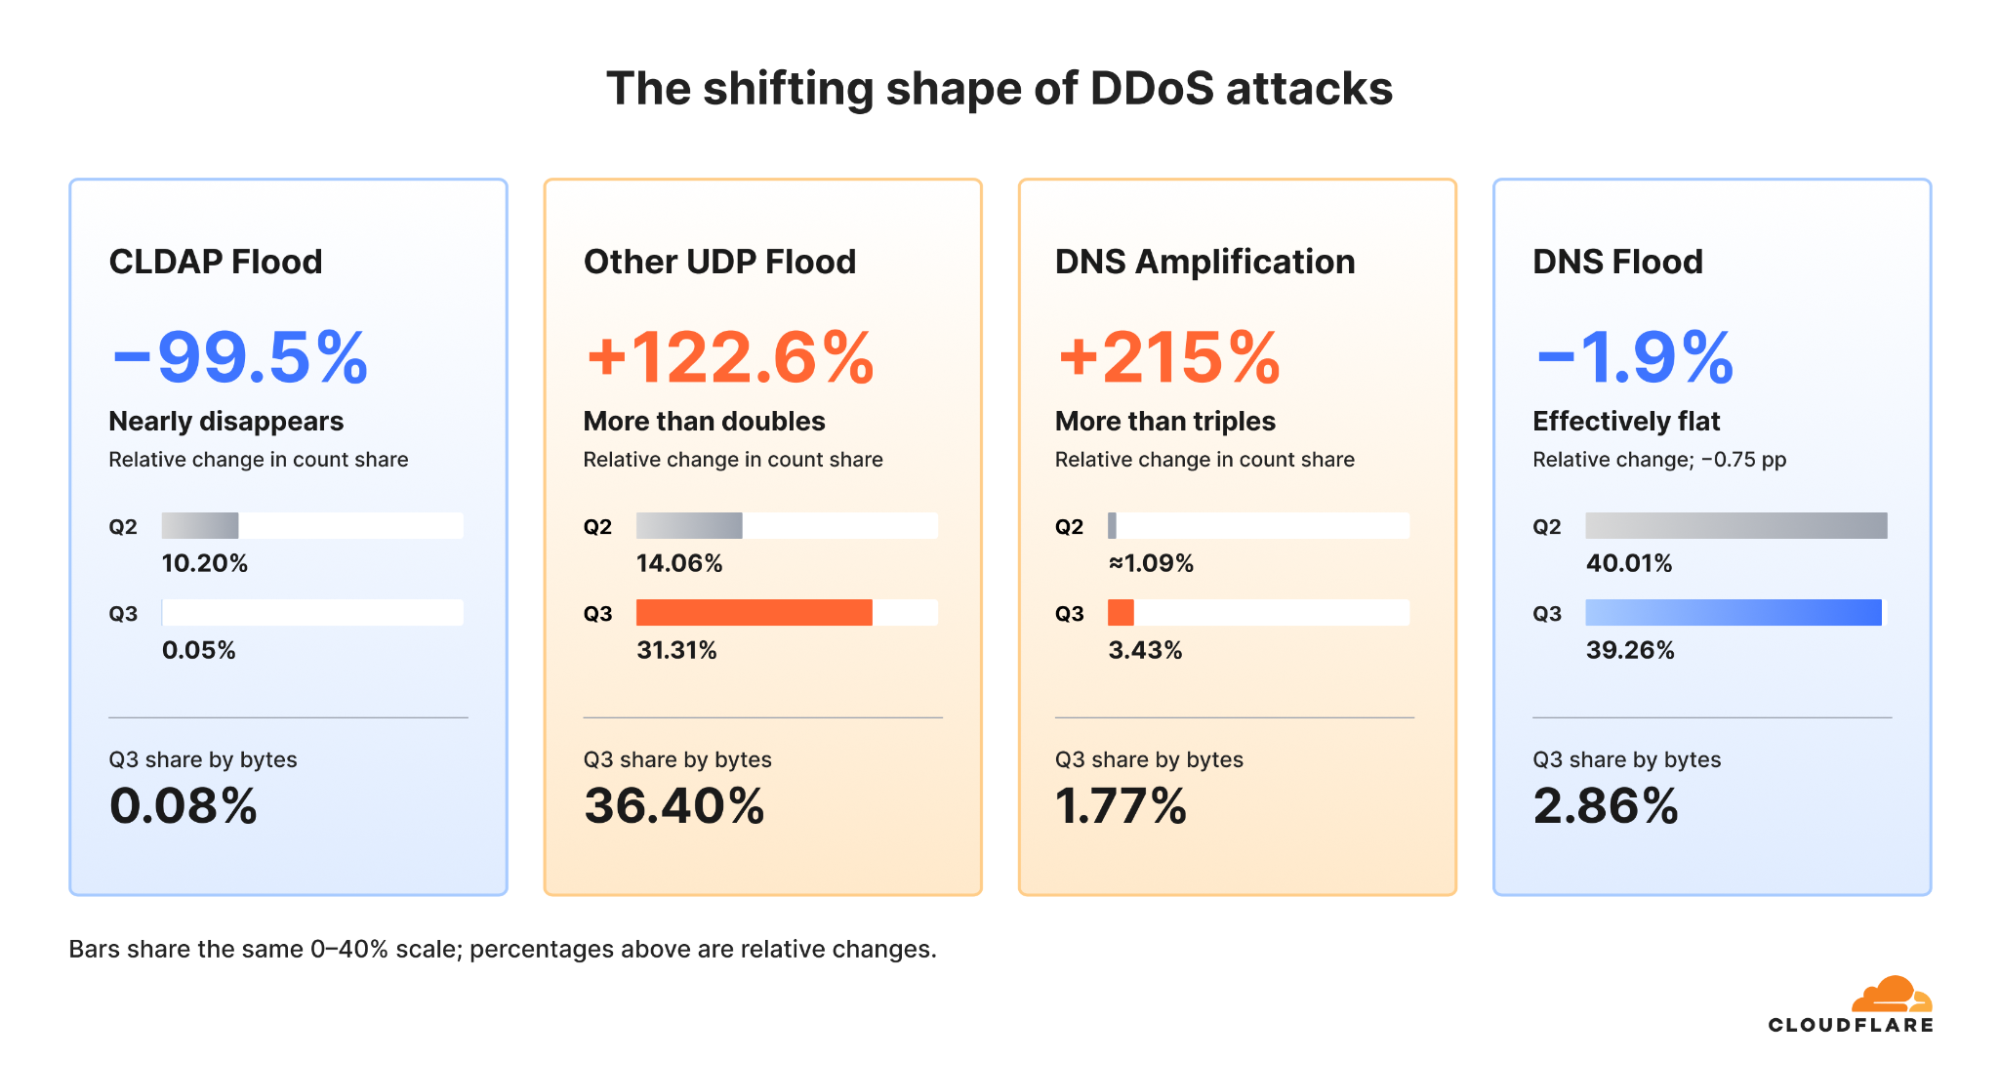
- The vector mix moved hard: CLDAP collapsed to 0.05% of attacks, DNS amplification rose 215% to 3.43%, and other UDP floods climbed from 14.06% to 31.31%.
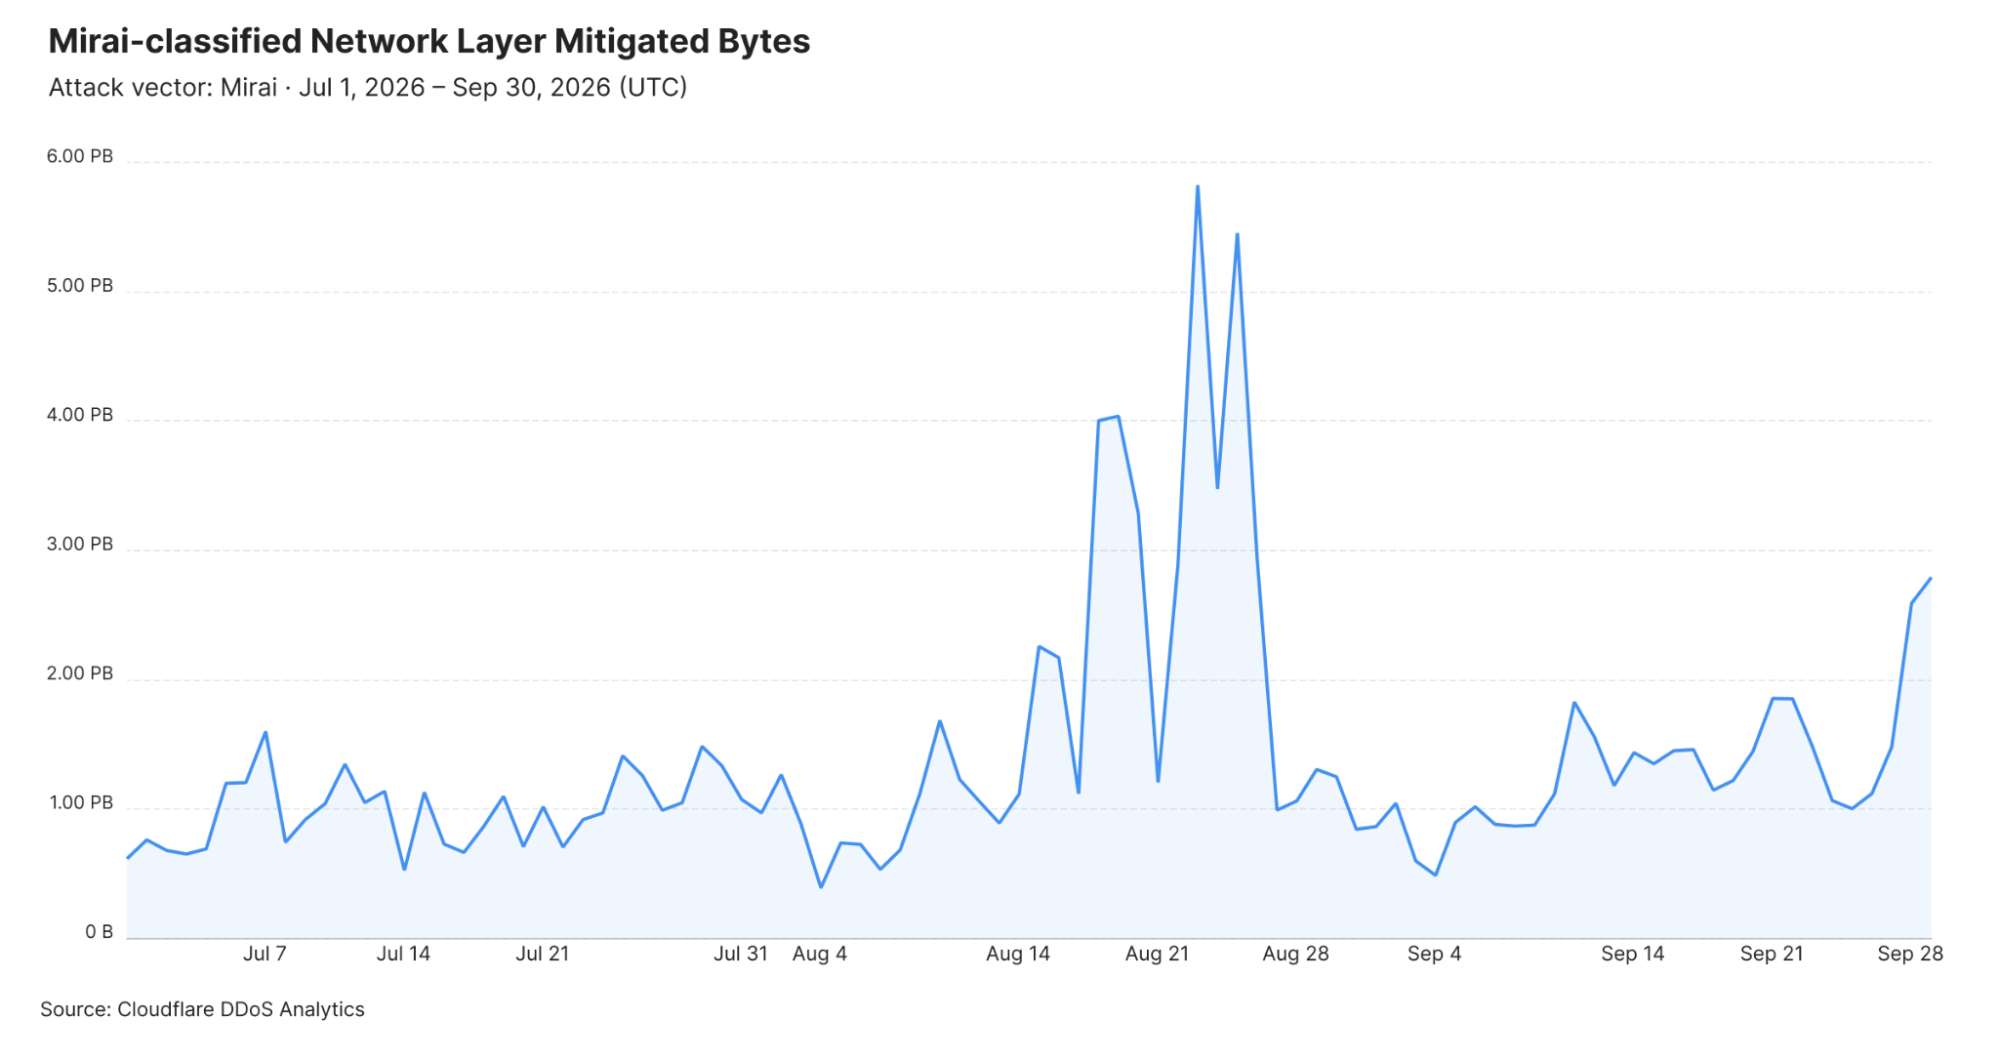
- Mirai-class traffic peaked at 57.23 PB in August, 46.5% of all mitigated network-layer bytes, and the longest sustained Mirai attack ran 49.7 hours.
- The target lists moved as well: Canada jumped from 16 to 6 and Israel moved seven places to 10, with the United States first, China second and Indonesia third at 2.93% of attacks.
- For an operator, the number that matters is time to mitigation in seconds, with rate limits and concurrency budgets on the routes that cost money.
The DDoS Threat Report is Cloudflare's quarterly read of its own traffic, and this edition covers July to September 2026. The report's volume figure establishes the scale. The shape of the attacks carries the quarter's operational signal: short attacks rose 208% and giant attacks fell 69%, changing the defensive problem for every team that runs an internet-facing service.
8,226 network-layer attacks an hour across Cloudflare's network
Cloudflare mitigated 18.2 million network-layer attacks and 14.4 trillion HTTP DDoS requests in the quarter. The company converts that into 8,226 network-layer attacks per hour, roughly 197,400 per day, or one attack every 0.44 seconds. Mitigated traffic reached 272.6 PB at the network layer and 95.1 PB at the HTTP layer.
Those totals describe a network built to absorb, and Cloudflare attributes the absorption to automation: every service sits behind unmetered DDoS protection across 330+ cities and 500 Tbps of capacity, and the systems detect and mitigate without a human in the loop. Read the numbers as a capacity statement from a vendor with an interest in the framing, and the useful part stays the same. The automation is the product because the attack cadence makes human response too slow. The hourly figure also describes a routine: this is what an automated layer absorbs on an average day, which is the baseline a smaller operator will meet on a bad one.
Short-burst swarms grew 208% while attacks above 1 Tbps fell to 251
Short-burst, mid-range, high-count attacks define the quarter. These carry the signature of DDoS-for-hire booter services: cheap, repeated, and small enough to look like a traffic spike on a graph built for terabits. Their volume rose 208% against the third quarter of 2025, and the report puts 96% of network-layer attacks under ten minutes and 98% under 1 Gbps.
The top targets by industry for that class of attack follow the money and the uptime promises: computer software at 21.1%, gambling and casinos at 14.4%, information technology and services at 14%, telecommunications at 12.4%, and consumer services next.
The industry ranking identifies the sectors most exposed to these attacks. Software companies, casinos and IT services appear among the leading targets for short-duration, mid-rate attacks in the quarter.
Hyper-volumetric attacks fell sharply. The count above 1 Tbps dropped to 251 from 805 in Q2, a fall of nearly 69%. The report says the drop may reflect law enforcement action in early 2026 against four of the largest IoT botnets, Aisuru, KimWolf, JackSkid and Mossad, and notes new variants arriving under the names Dysphoria and Evooo1Bot. Take the pairing seriously: a takedown moves the number for a quarter, and the ecosystem churns replacements.
A takedown works as a supply shock for the people who rent these botnets, and the report's own numbers show the market adjusting: attacks above 1 Tbps fell while the total count of attacks rose. Together, the figures describe smaller attacks in larger numbers, a trend that defensive budgets have to cover.
UDP floods carry 31.31% of attacks as CLDAP collapses to 0.05%
Reflection and amplification tactics rotated. CLDAP floods, which had surged 580% quarter over quarter through the first half of 2026, collapsed to 0.05% of attacks, a 99.5% fall. Attackers moved to other connectionless protocols: DNS amplification rose 215% to 3.43% of network-layer attacks, and other UDP floods climbed from 14.06% to 31.31%.
Both use a similar reflection-and-amplification pattern, which is why the swap costs attackers so little. A small query with a forged source address reaches an open resolver or domain controller, and a much larger reply lands on the victim. Closing open resolvers stays the cheapest structural fix available to any organisation that runs one.
Check the exposure yourself before reading further into the report. Any resolver or domain controller that answers recursion from the open internet is a candidate reflector, and a scan from an external host settles the question faster than a policy review does.
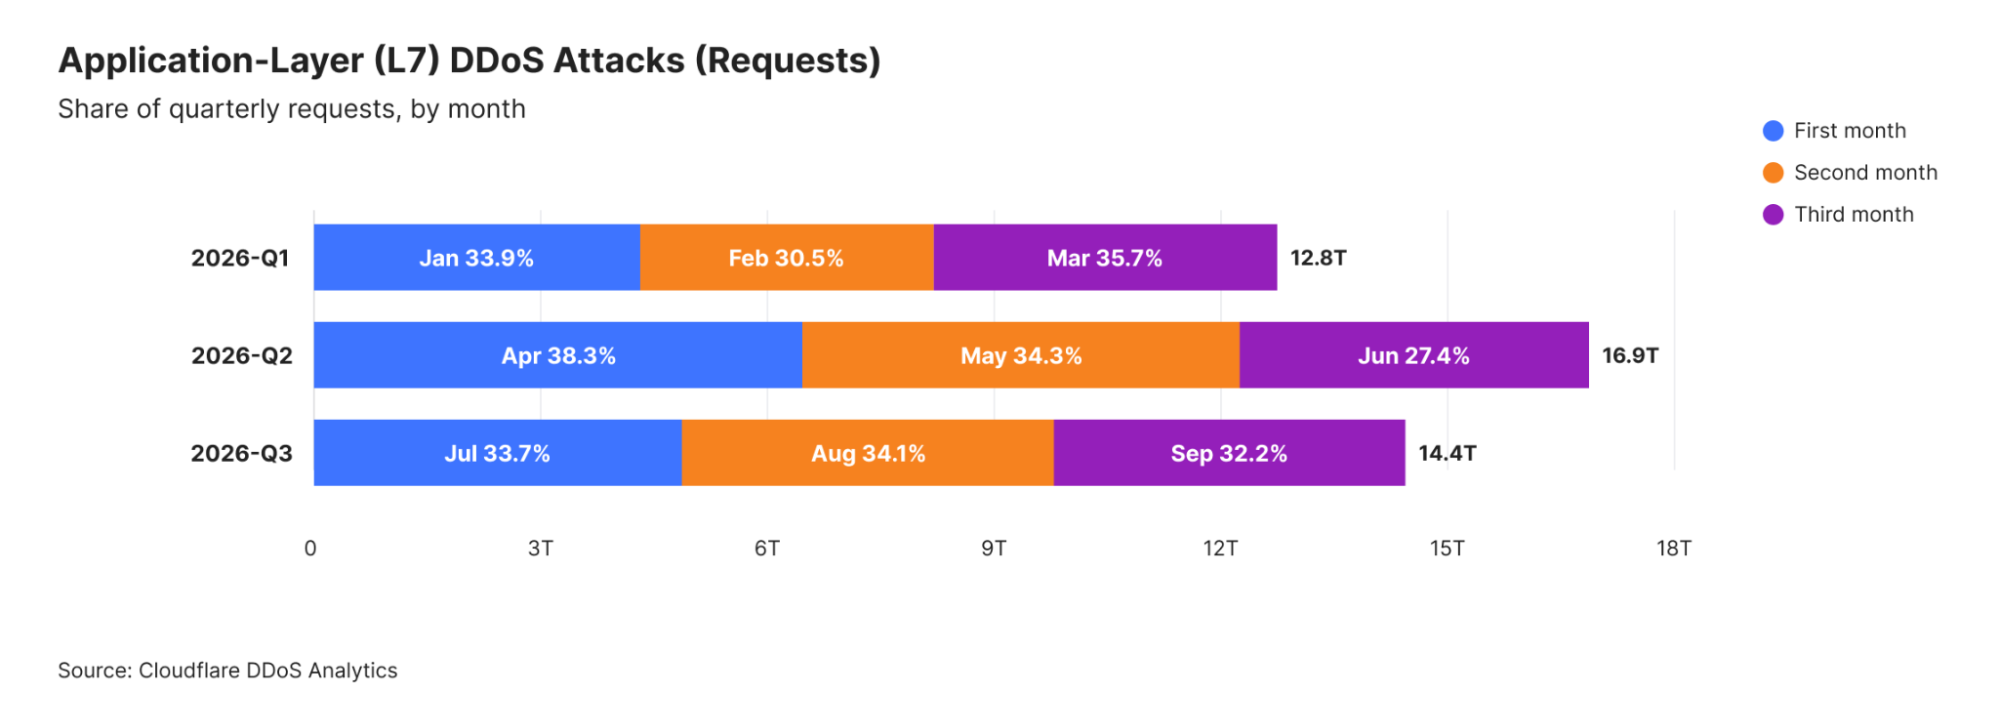
Mirai-class traffic peaked at 57.23 PB in August
Mirai-classified mitigation peaked at 57.23 PB in August and accounted for 46.5% of all mitigated network-layer bytes in the quarter. Four days cleared three petabytes each: 16, 19, 23 and 25 August. The longest sustained Mirai attack ran 49.7 hours, from 19 to 21 August.
A two-day attack breaks the on-call rotation that a ten-minute attack never touches. Plan the escalation path for both durations, because the quarter produced both shapes in volume.
Mirai scanners recompile and rescan continuously, so the classified volume tracks how much of the internet still answers on the old ports. Patch the firmware, close the telnet door, and the bytes on that chart belong to somebody else's estate.
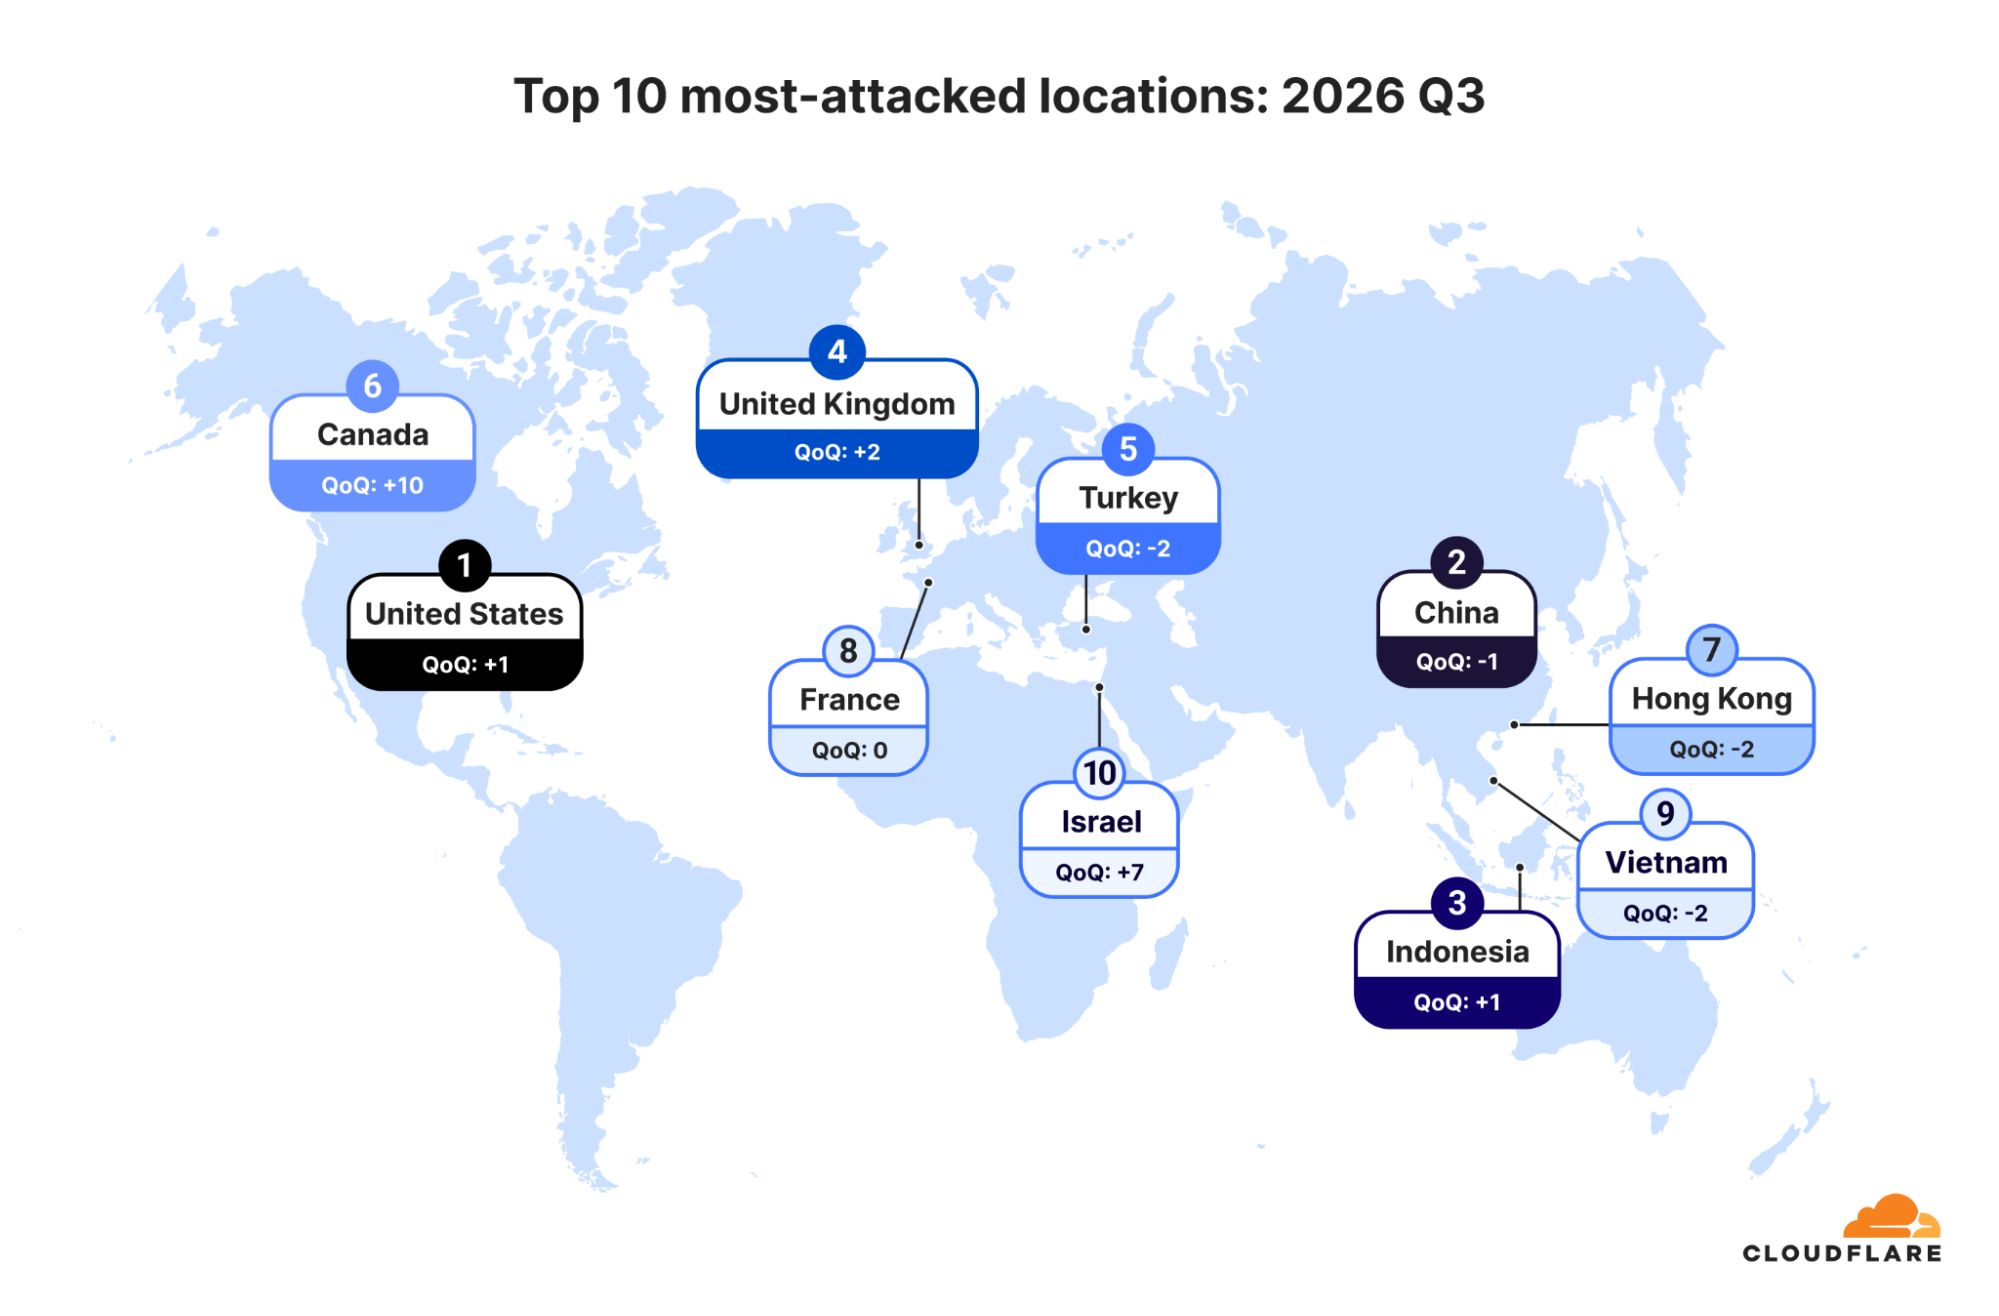
The target lists moved: Canada to 6, Israel to 10, Indonesia to 3
Geographic rankings changed sharply. Canada jumped from 16 to 6 on the back of attacks against retail, telecommunications, service providers and marketing, and Israel moved 7 places to 10 after sustained activity in mid-September. The United States reclaimed first place from China, and Indonesia entered the top three at 2.93% of attacks.
Industry targeting broadened in the same way. Media, production and publishing stayed first with a share roughly a quarter of its Q2 level, Internet rose from outside the top 10 to 6, and consumer services and adult entertainment entered at 8 and 9.
Position changes follow local news more closely than global capacity. A retail chain in the middle of a public dispute, or a telecom defending a price rise, becomes a target for reasons that have nothing to do with its architecture, and the ranking records the result three months later. Read it as a quarterly map of targets selected amid local business and political events, with direct consequences for technical risk.
Netics' take: a ten-minute attack outruns a human review queue
Ninety-six percent of these attacks end before an analyst finishes reading the alert. That single distribution invalidates the review workflow most small teams still run: a monitor fires, someone opens a dashboard, someone decides, and the attack has already stopped.
The mitigation has to be a policy that fires on its own, written before the incident and narrow enough to keep good traffic. And the review still happens, one day later, on the traffic that the policy let through. A related analysis of edge visibility, the argument about who actually sees your traffic at the edge, reaches the same conclusion, and the operational reading holds: the policy that runs unattended is the only one that runs in time.
What this means for businesses: rate limits, per-route budgets and seconds
Four moves cover most of the exposure this report describes, and none of them needs a security team of ten.
- Measure time to mitigation per route and per hostname. A single site-wide average can hide a heavily targeted login route.
- Put rate limits and concurrency budgets on the routes that cost real money: login, password reset, search, checkout and any endpoint that queries a database.
- Size origin capacity for the traffic that reaches it after the edge decision, and record that number, because a 1 Gbps attack against an unprotected origin is enough.
- Treat the ten-minute attack as an incident and record a written outcome for attacks that leave the page available.
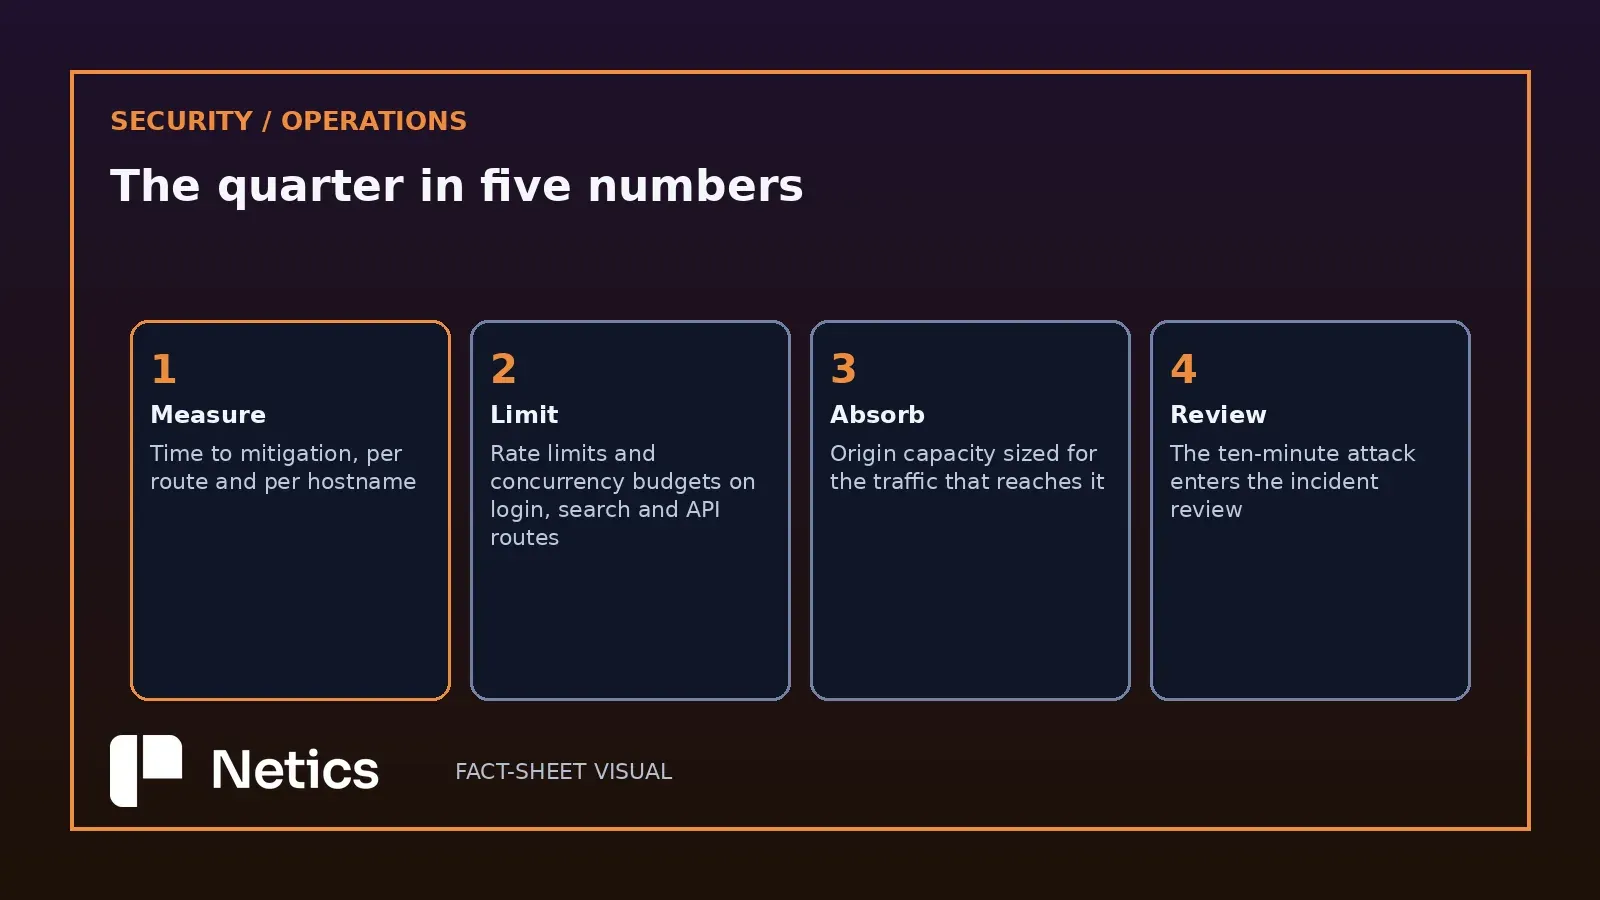
The follow-on work is unglamorous and effective: rate limits on the expensive routes, a mitigation policy that runs without permission, and a dashboard that shows attempts next to successes. Infrastructure monitoring with plain-language alerts covers the part where a human has to notice, and the graph is where a swarm first looks like a normal Tuesday.
Sources
Source: Cloudflare DDoS Threat Report 2026 Q3, blog.cloudflare.com, published 2026-10-29 and read on 2026-10-31. The 18.2 million network-layer attacks, 14.4 trillion HTTP requests, 8,226 attacks an hour, the 0.44-second interval, 272.6 PB and 95.1 PB of mitigated traffic, the 208% growth, the 96% and 98% shares, the 69% fall above 1 Tbps with 251 attacks against 805 in Q2, the four named bots and two new variants, the CLDAP collapse to 0.05%, the 215% DNS amplification rise to 3.43%, the UDP share moving from 14.06% to 31.31%, the 57.23 PB Mirai peak with the four three-petabyte days and the 49.7-hour attack, the industry shares, the location changes, and the 330+ cities with 500 Tbps of capacity all come from that report. The operating sequence and the reading of what the duration distribution means are Netics analysis.