
A Cost Comparison Method for Leaving the Public Cloud
A cloud exit is decided by arithmetic that starts in twelve months of invoices. This method splits every line into storage, transfer and compute, prices each bucket at published rates, adds

TL;DR
- A cloud exit is a project that moves workloads off a provider's rented infrastructure onto servers the organisation operates and pays for directly, and the cost comparison is the arithmetic that decides whether the move pays for itself.
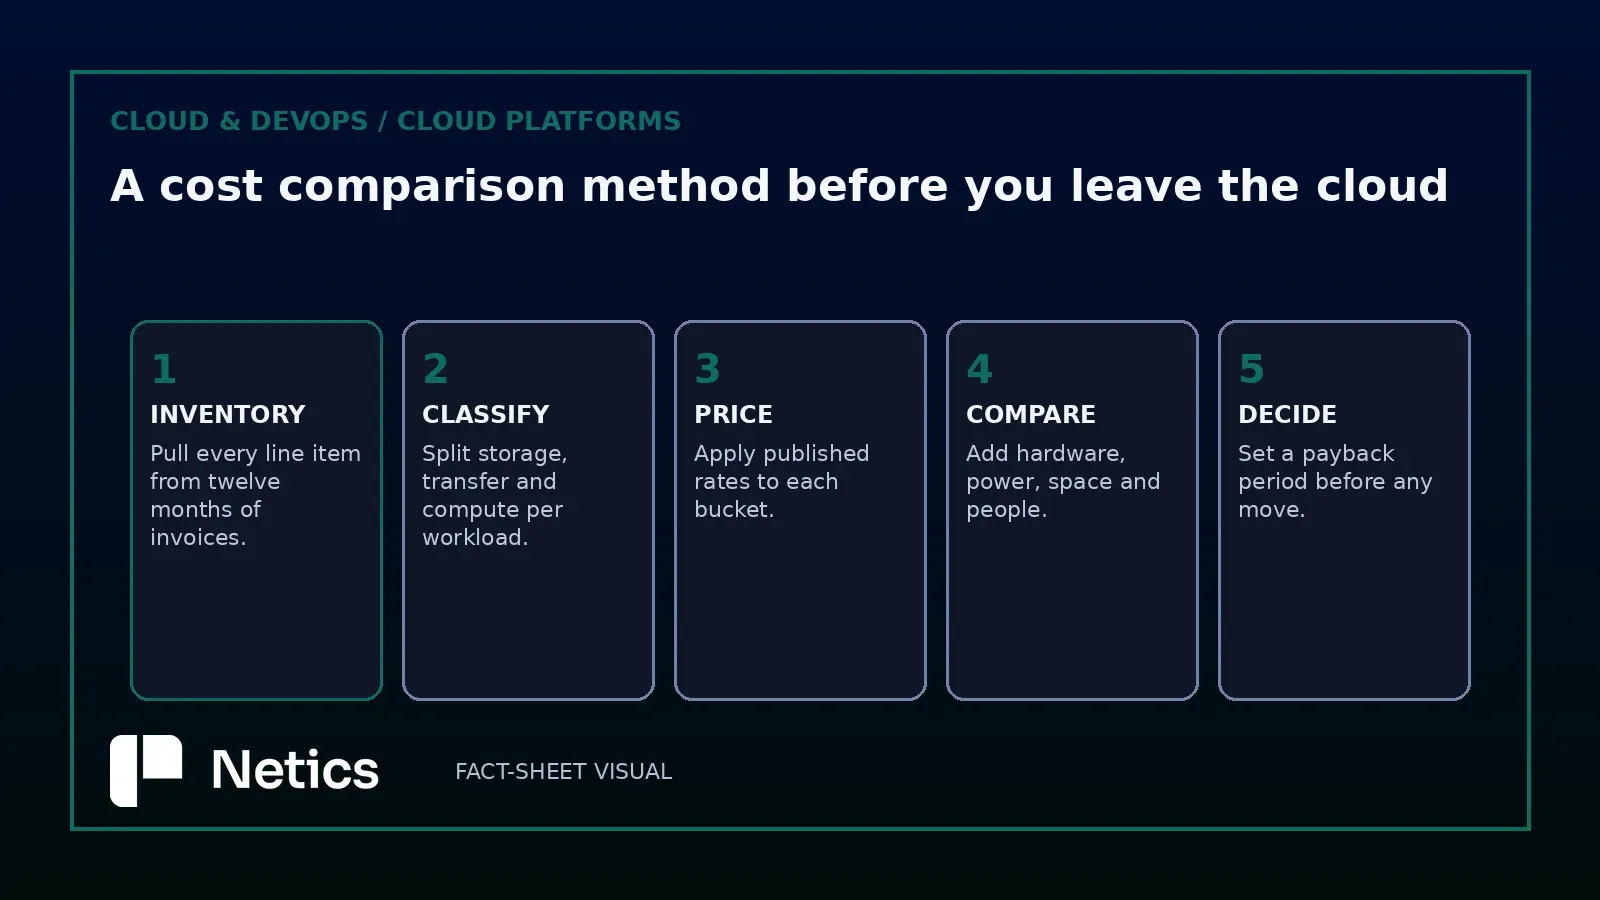
- The method has five steps: inventory twelve months of invoices, classify every line as storage, transfer or compute, price each bucket at published rates, add hardware, racks, power and people, then set a break-even date.
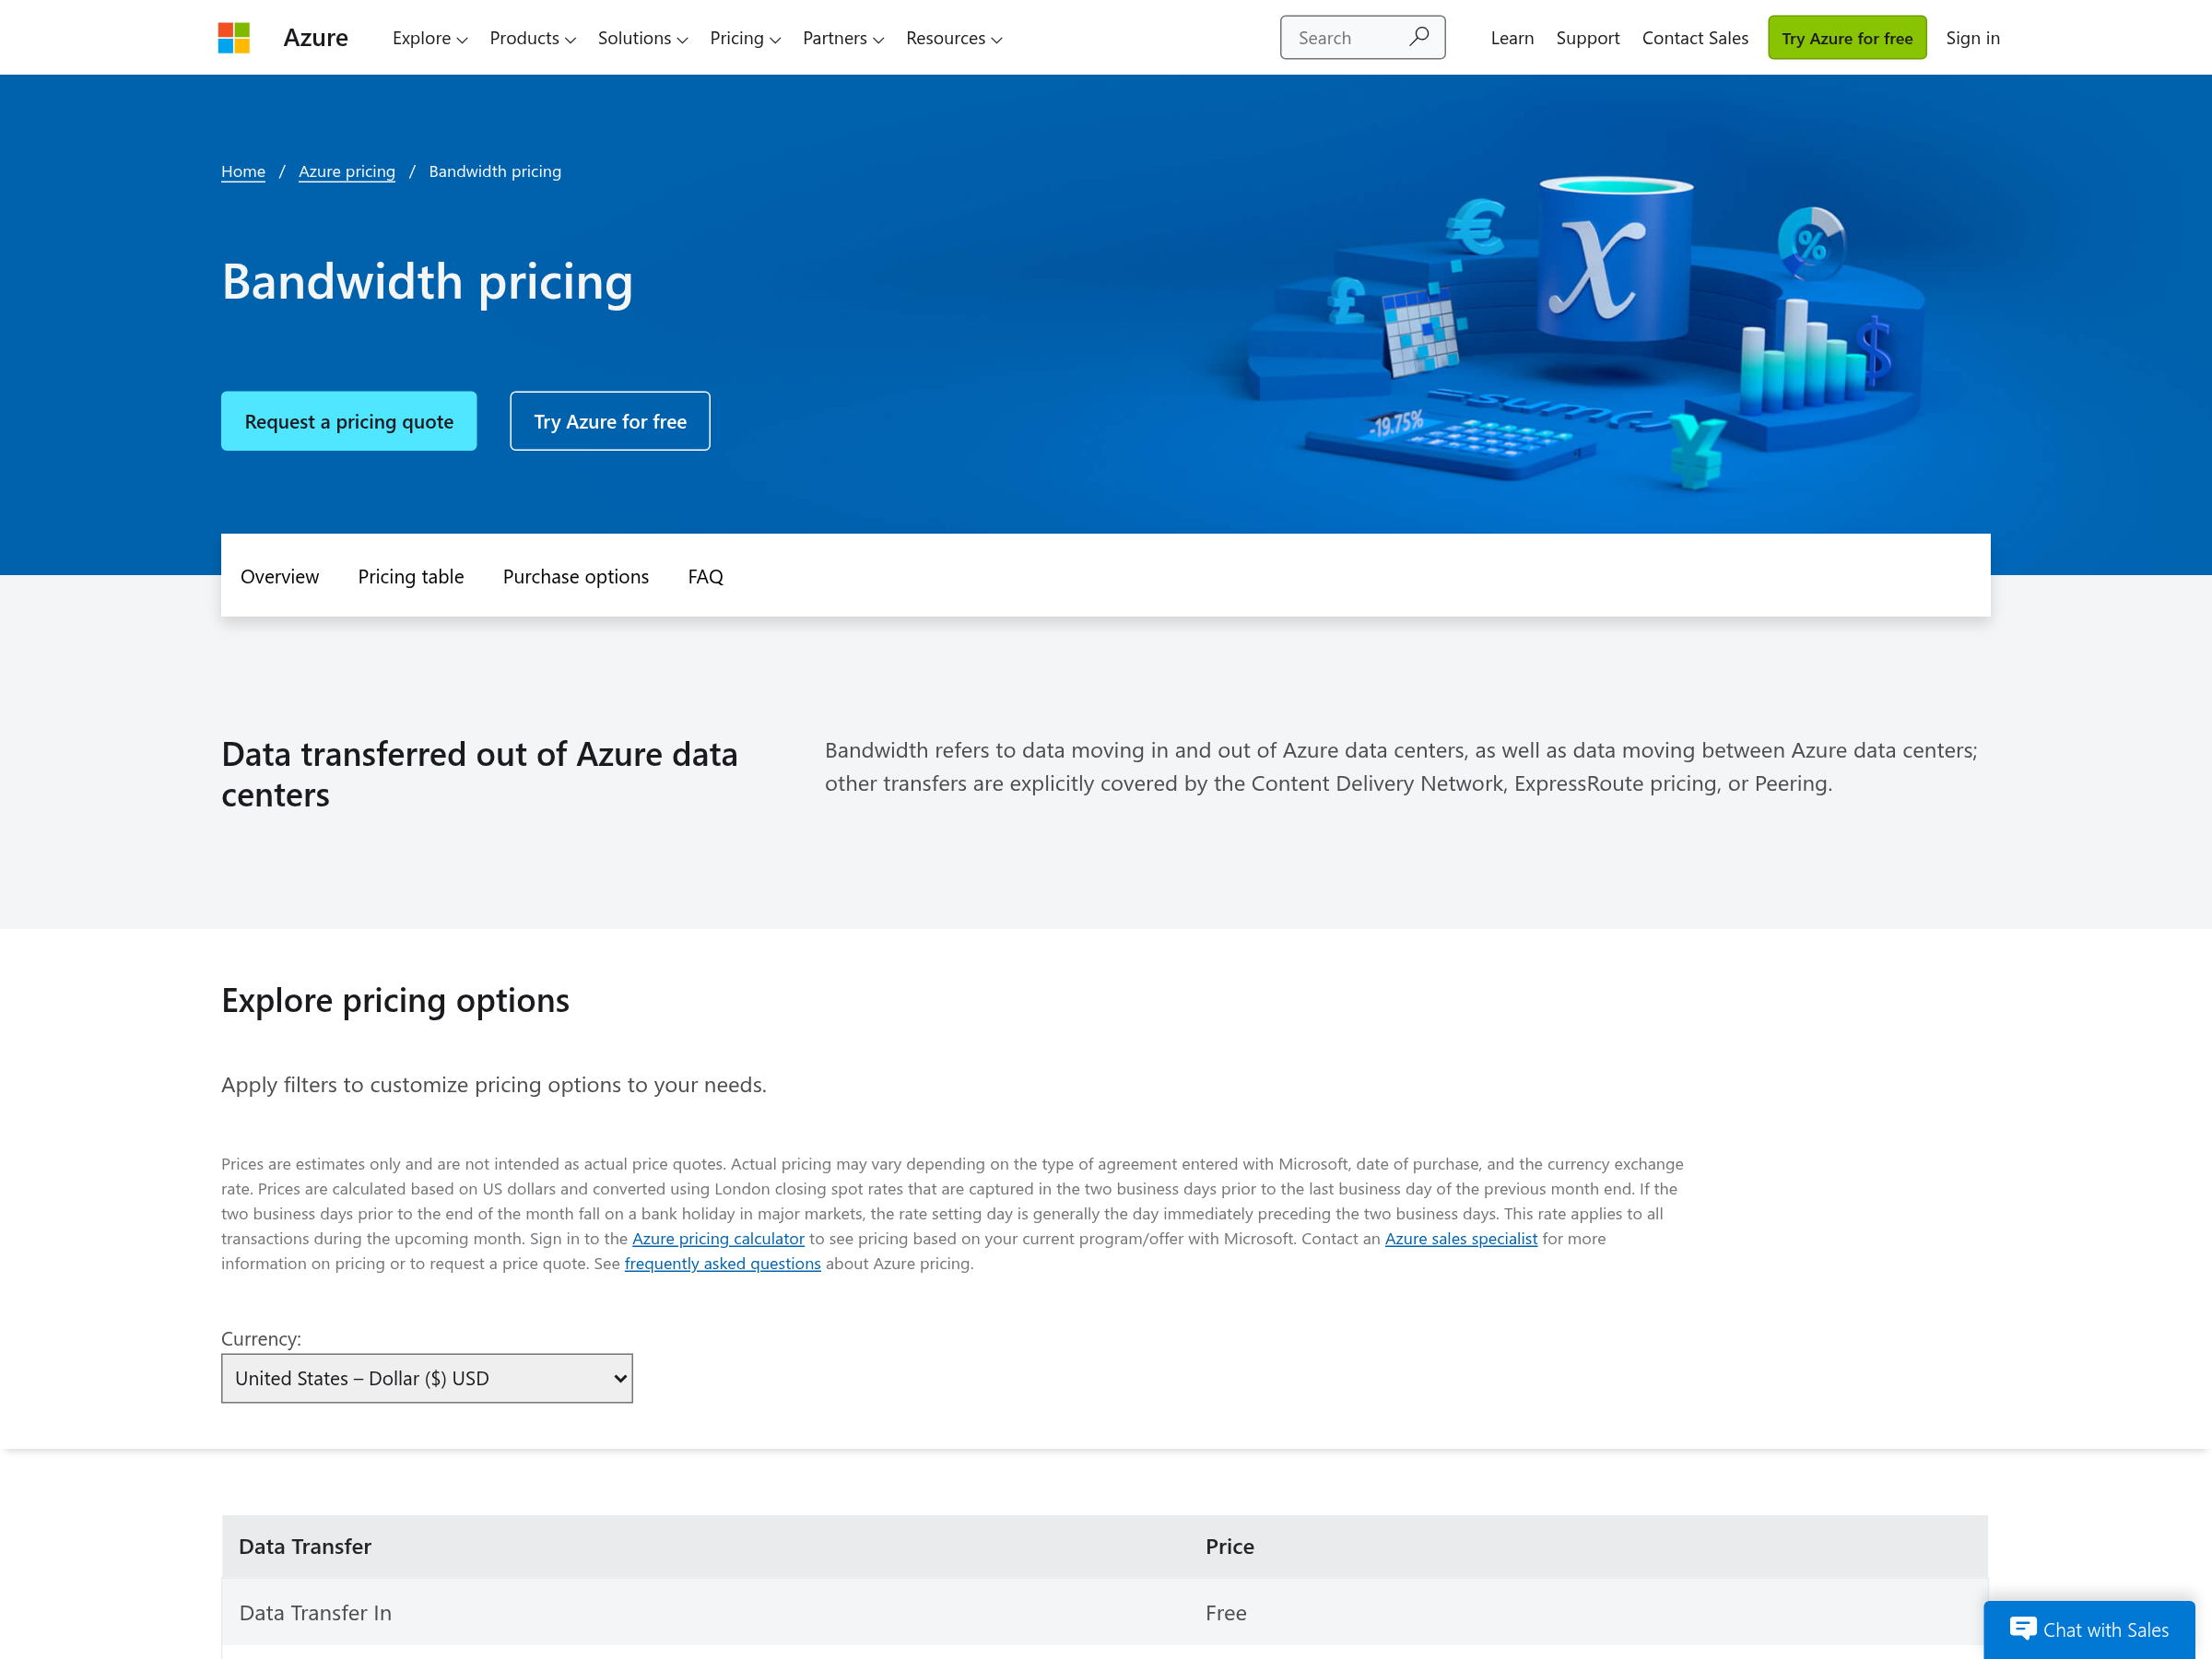
- Published inter-region rates show how providers meter transfer; the exit itself is priced separately, at the provider's internet egress rate. Cloudflare charges nothing for egress on R2, Microsoft charges $0.02 per GB between regions inside Europe, and Amazon's own S3 example prices inter-region transfer at $0.02 per GB.
- The best-documented public example is the projection 37signals published in 2023: $3.2m of cloud spend in 2022, a hardware order of about $600,000, $720,000 a year for eight racks of space and power, and roughly $840,000 a year against $2.3m of cloud servers.
- The costs the invoice leaves out — redundancy, spares, patching, on-call and the migration itself — decide whether a defensible saving survives contact with operations.
- A break-even date turns the whole argument into one number a finance team can approve or refuse.
The cloud invoice prices units of consumption
A cloud bill is a measurement, and it measures one thing: consumption of units the provider defines. Storage is billed per gigabyte-month, transfer per gigabyte leaving a region, requests per million calls, compute per second of a machine that exists because a tenant asked for it. That structure is useful while the workload stays on the provider's side of the wall, because the numbers arrive already aggregated and already trusted by the finance team.
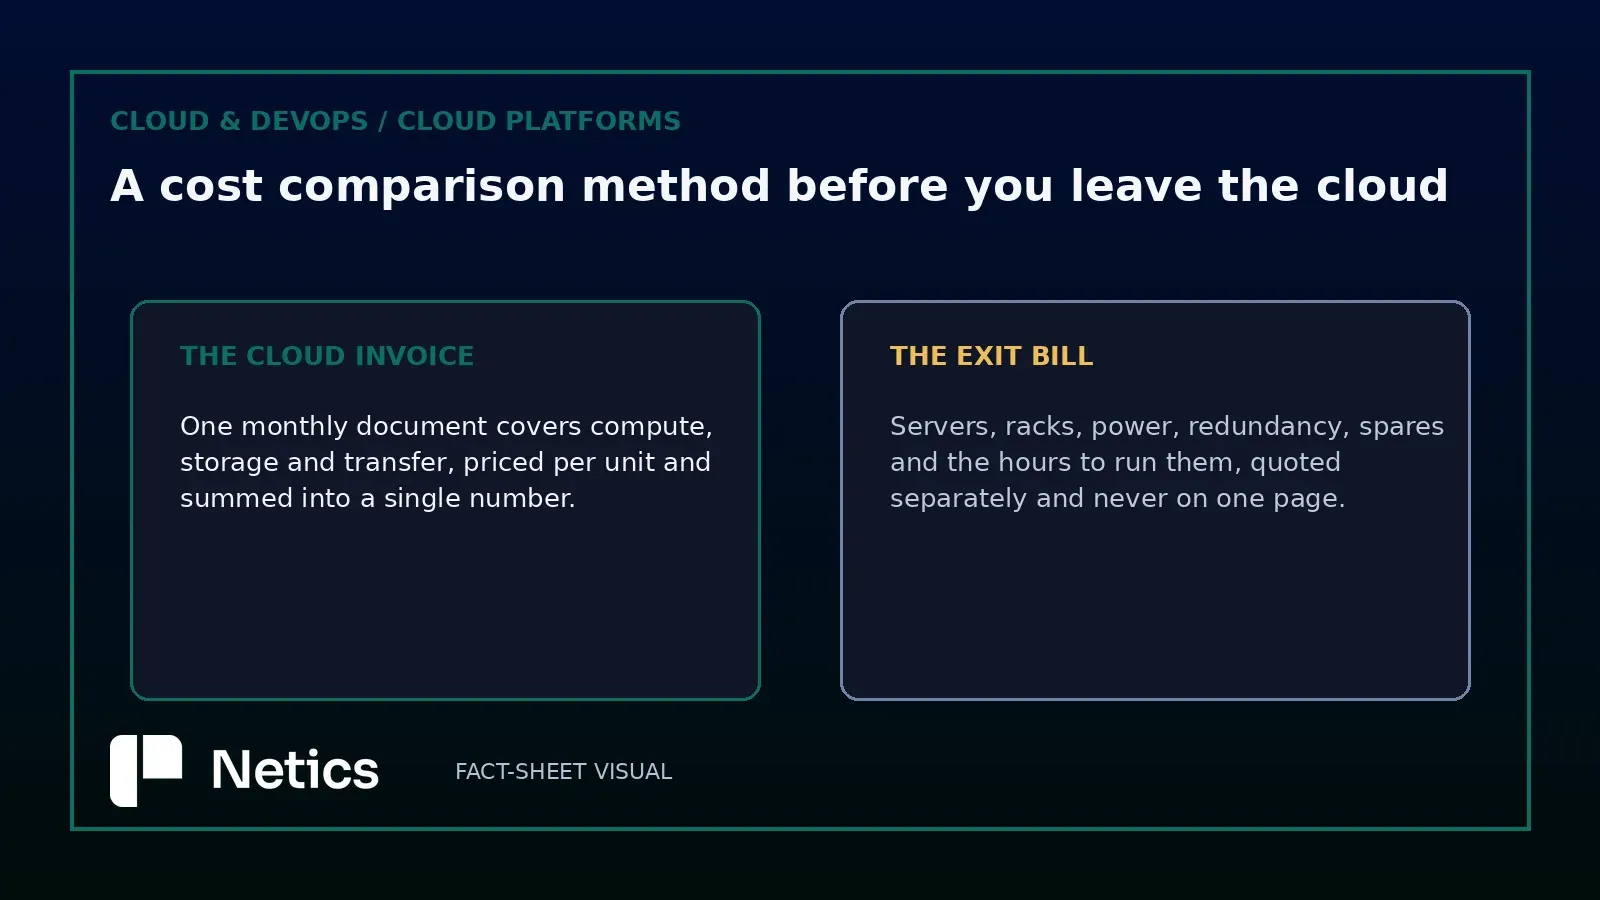
The problem with using the same document to price an exit is that it never records what an organisation stops paying for. A server the company owns has no per-second meter, so the cost of running it appears in a hardware invoice once, in an electricity contract every month, in a rack rental every month, and in salary every month. None of those four lines sit on the cloud invoice, which is why the two sides of the comparison are usually assembled by different people at different times with different assumptions.
Reading the invoice as a price list first, and only afterwards as a bill, is the step that makes the rest of the method possible. Every line on it belongs to one of three buckets, and the three behave differently when a workload leaves.
Start with twelve months of invoices
In Netics' analysis, twelve months is the shortest window that contains a seasonal peak, an annual renewal and at least one incident. A quarter of billing data will usually understate the peak that sized the environment in the first place, and the peak is what an on-premises design has to absorb.
Pull the line items, and keep the totals for cross-checking. Providers expose per-service and per-region breakdowns, and the interesting rows are the small recurring ones: snapshots nobody deleted, log storage that grew quietly, cross-region replication for a bucket used by one application, load balancers kept alive for a test that ended. Each of those has a hardware equivalent that is either needed or avoidable, and the answer changes the total.
Group the twelve months by application where the tagging allows it. An organisation that cannot attribute spend to an application cannot price an exit per application either, and the fallback is a single all-or-nothing migration that carries far more risk than moving one workload at a time. Tagging discipline is the cheapest prerequisite in the whole project.
Classify every line as storage, transfer or compute
The three buckets translate to on-premises costs in three different ways, and mixing them produces the arithmetic errors that make exits look either impossible or free.
Storage is the easiest to translate. A gigabyte-month on a provider's object store maps to disks, a filesystem, a replication policy and a backup target. The unit price of the disk will look dramatically lower, and the honest comparison includes the second copy, the off-site copy and the person who tests restores. Cloudflare's own documentation lists standard storage at $0.015 per GB-month, and this article takes that published R2 rate as the yardstick a self-hosted terabyte has to beat once redundancy is counted.
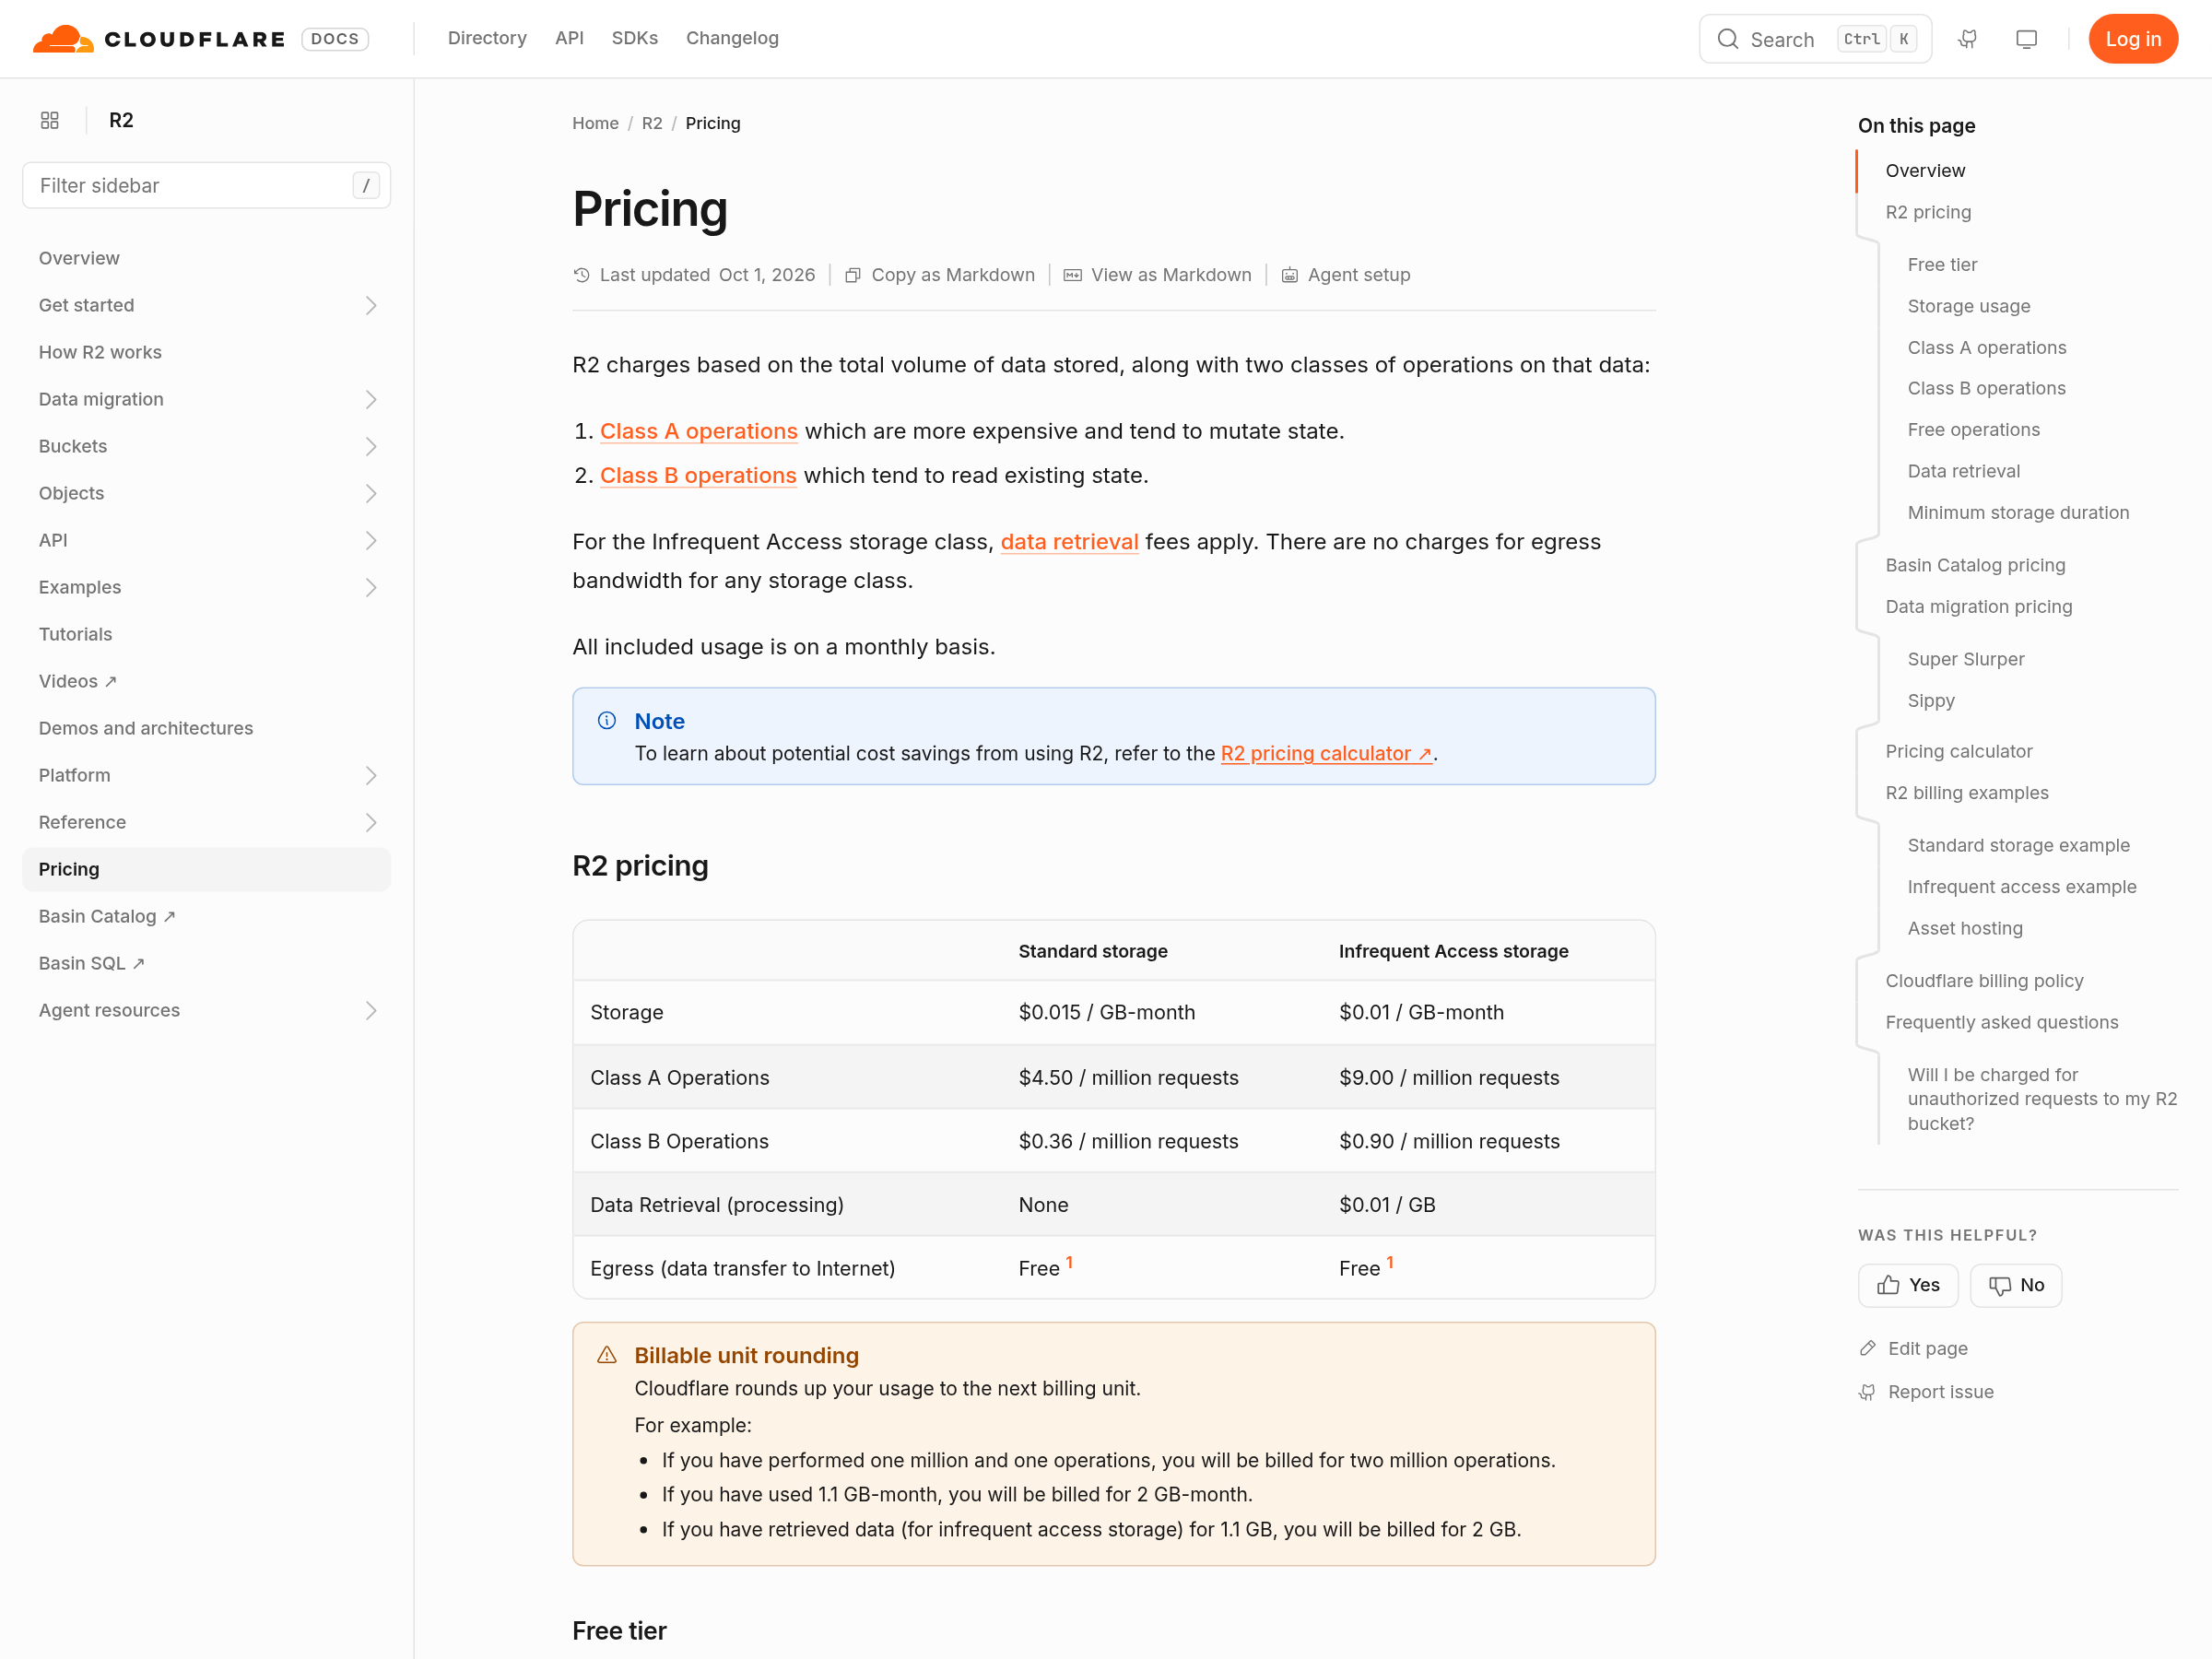
Transfer is where published prices diverge most. Microsoft charges nothing for data transfer in, and $0.02 per GB for intra-continental transfer between regions within Europe. Cloudflare states plainly that there are no charges for egress bandwidth on R2 for any storage class. Amazon's S3 pricing example prices inter-region transfer out at $0.02 per GB. These inter-region figures show how each provider meters transfer between its own regions. Data leaving for the organisation's own servers is billed at the provider's internet egress rate, which the migration step below prices. An organisation whose bill is dominated by data leaving a region is comparing against a colocation cross-connect and a bandwidth commit, and that comparison has a completely different shape from one dominated by compute.
Compute is the bucket that needs the most care. A reserved instance, a savings plan and an on-demand hour are three different prices for the same silicon, and the on-premises equivalent is a server amortised over a realistic life with a spare capacity margin. Reading only the discounted rate flatters the cloud; reading only the on-demand rate flatters the exit.
Price each bucket at published rates
Published rates matter because they are the only figures both sides of the argument accept without negotiation. A vendor price sheet can be cited in a board paper; an internal estimate cannot.
The exercise is mechanical once the buckets exist. Take the storage gigabyte-months from the invoice, price them at the cheapest tier the workload actually tolerates, and add the redundancy copies the current design implies. Take the transferred gigabytes and price them at the destination rates the provider publishes for the region pairs in use. Take compute hours at the commitment level the organisation genuinely runs, and note separately what the same hours would cost on demand, because that gap is the first thing a provider will offer to close.
Doing this exercise before any migration decision usually produces one of two findings. Either the bill is dominated by a service with no realistic self-hosted equivalent — a managed queue, a global anycast edge, a database with a control plane nobody wants to operate — in which case the exit discussion narrows to the workloads that can move. Or the bill is dominated by commodity compute and storage, in which case the numbers are large enough that the operational question becomes worth answering.
Either finding is useful, and both are cheaper to reach on a spreadsheet than after a migration.
Add what the invoice leaves out
The exit bill has five components that never appear on a cloud invoice, and each has a real price.
Hardware is the visible one: servers, disks, network gear and spares, amortised over a life the organisation is willing to defend. Racks and power come next, usually as a monthly line from a colocation provider or as an internal charge for space and cooling. Redundancy is the third and the most consistently underestimated, because the provider absorbs a failed disk or server without the tenant doing anything, and in a rack that work falls to the organisation.
People are the fourth. Running infrastructure means patching, capacity planning, certificate renewal, backup verification and on-call rotation, and the honest version of the comparison names the hours. An organisation that already employs the people does not get to price them at zero, because those hours were previously spent elsewhere.
The migration itself is the fifth, and it is a one-off cost with a long tail. Moving data out of the provider to the organisation's own servers counts as egress to the internet, which the inter-region rates quoted above do not cover, so the exit fee has to be priced from the provider's own internet egress rate, sometimes on a very large volume. The tail is the period where both environments run in parallel and the organisation pays for both.
Set a break-even date
A comparison without a date is a debate. With a date, it becomes a decision rule: the move happens if the accumulated saving crosses the accumulated cost within a period the organisation is willing to wait.
The arithmetic is straightforward. Take the annual cloud spend attributable to the workloads being moved, subtract the annual run cost of the replacement, and divide the one-off cost — hardware, migration, parallel running — by that annual difference. The result is a payback period in years, and it should be stated with the assumptions that produced it visible on the same page.
Two sensitivities belong next to that number. The first is hardware life: a four-year refresh shortens the period, a seven-year one lengthens it. The second is the rate at which the remaining cloud spend grows, because a workload that grows ten percent a year changes the crossover date and a shrinking one may never justify the move at all.
A payback period of a few years is a decision most finance teams can take. A payback period that depends on optimistic assumptions about both hardware life and growth is a decision to revisit, and saying so is part of the method.
What the arithmetic looks like when a company publishes it
Publicly itemised exits are rare, which makes the 37signals account of February 2023 worth reading as a partial worked example of the method, with two caveats: its figures are the company's own preliminary projection, published before the move, and they cover the run-cost side only. The post gives no migration or parallel-running cost and no break-even date, so the last step of the method has no worked figure here.
The company spent $3.2m on cloud in 2022. Just under a million of that stored eight petabytes of files in S3, fully replicated across several regions; the remaining roughly $2.3m covered application, cache, database and search servers, and that was the part it intended to bring to zero. The hardware order came to somewhere in the region of $600,000, which the post amortises over a conservative five years at $120,000 per year. Eight dedicated racks across two data centres cost about $60,000 per month through a colocation provider, which is $720,000 per year, with enough space and power already provisioned to absorb the new machines.
Add those together and the run cost is about $840,000 per year against $2.3m in the cloud. The post calls the difference a saving of roughly $1.5m per year, sets aside half a million for unforeseen expenses over the period, and arrives at seven million dollars saved over five years in server expenses, with the ops team unchanged in size. Those are the post's rounded figures: $2.3m minus $840,000 is about $1.46m a year, about $7.3m over five years, and about $6.8m once the $500,000 is set aside. The seven-million figure covers the roughly $2.3m of servers only: the post defers the exit of the eight petabytes from S3 to 2024 and gives no cost for moving them out.
The value of the example is that every number has a source and a position in the method, and its weak points are just as visible. Storage was separated from compute. Hardware was amortised across five years. Racks and power were priced as a monthly line. The saving was stated as one rounded figure with a $500,000 contingency, and the five-year window was declared. Two assumptions need the scrutiny the method asks for. The only people cost is an ops team unchanged in size, with no hours named, which is exactly the line the method refuses to price at zero. And the figures are the company's own rough, preliminary calculations, made before the move, so they illustrate the method and leave the outcome unproven. An organisation can disagree with any single assumption and still use the structure to reach its own answer.
Sources
Source: We stand to save $7m over five years from our cloud exit — David Heinemeier Hansson, world.hey.com, 21 February 2023, retrieved 2026-10-18 (the $3.2m of cloud spend in 2022, just under a million of it on eight petabytes of files in S3 fully replicated across several regions, about $2.3m on application, cache, database and search servers, a hardware order of roughly $600,000 amortised over five years at $120,000 per year, about $60,000 per month for eight dedicated racks across two data centres through Deft, a total of about $840,000 per year, a saving of about $1.5m per year, half a million set aside for unforeseen expenses, and seven million dollars saved over five years without changing the size of the ops team, presented as preliminary, rough calculations, with the exit of the 8PB from S3 deferred to 2024).
Source: Pricing — Bandwidth — Microsoft Azure, azure.microsoft.com/en-us/pricing/details/bandwidth/, retrieved 2026-10-18 (data transfer in free; data transfer within the same availability zone free; intra-continental data transfer between regions within Europe and within North America at $0.02 per GB; within Asia, Oceania, Middle East and Africa at $0.08 per GB; within South America at $0.16 per GB; inter-continental transfer from North America or from Europe to other continents at $0.05 per GB).
Source: Pricing — Cloudflare R2 documentation, developers.cloudflare.com/r2/pricing/, last updated 2026-10-01, retrieved 2026-10-18 (standard storage at $0.015 per GB-month, Infrequent Access at $0.01 per GB-month, Class A operations at $4.50 per million requests, Class B operations at $0.36 per million requests, data retrieval on Infrequent Access at $0.01 per GB, no charges for egress bandwidth for any storage class, and the 10 GB-month free tier).
Source: Amazon S3 pricing — aws.amazon.com/s3/pricing/, retrieved 2026-10-18 (the worked example charging inter-region data transfer out at $0.02 per GB and S3 GET requests from the Standard storage class at $0.0004 per 1,000 requests).
Source: the 37signals cloud-exit post of 21 February 2023 and the Azure, Cloudflare R2 and Amazon S3 pricing pages retrieved 2026-10-18 — every figure above traces to one of those pages. Images are captures of Microsoft's bandwidth pricing page and Cloudflare's R2 pricing page, plus two Netics editorial diagrams. Netics runs sovereign infrastructure and cloud exit engagements, and the free audit is where a bill becomes this arithmetic.