
Google WeatherNext 3 Turns Forecasting Into a Live Operations Signal
Google WeatherNext 3 moves weather AI from periodic, coarse forecasts toward hourly observation-driven signals. European SMEs should validate the data before automating decisions.

TL;DR
Google’s WeatherNext 3 is not just a sharper version of a familiar weather app. Google says the model ingests live geostationary satellite mosaics and station observations, refreshes forecasts hourly, and produces higher-resolution outputs than WeatherNext 2. Its architecture moves the centre of gravity from a periodic forecast product toward a continuously refreshed observation-to-prediction system. That matters to European SMEs because weather is already an input to logistics, field service, construction, agriculture, retail, energy and insurance decisions. The opportunity is not to let an AI model make those decisions alone. It is to test whether a fresher, more local signal improves a specific operational threshold, with a fallback to official meteorological services and a clear record of uncertainty. The precipitation claim is promising, but it still needs local validation.
The important change is in the input loop
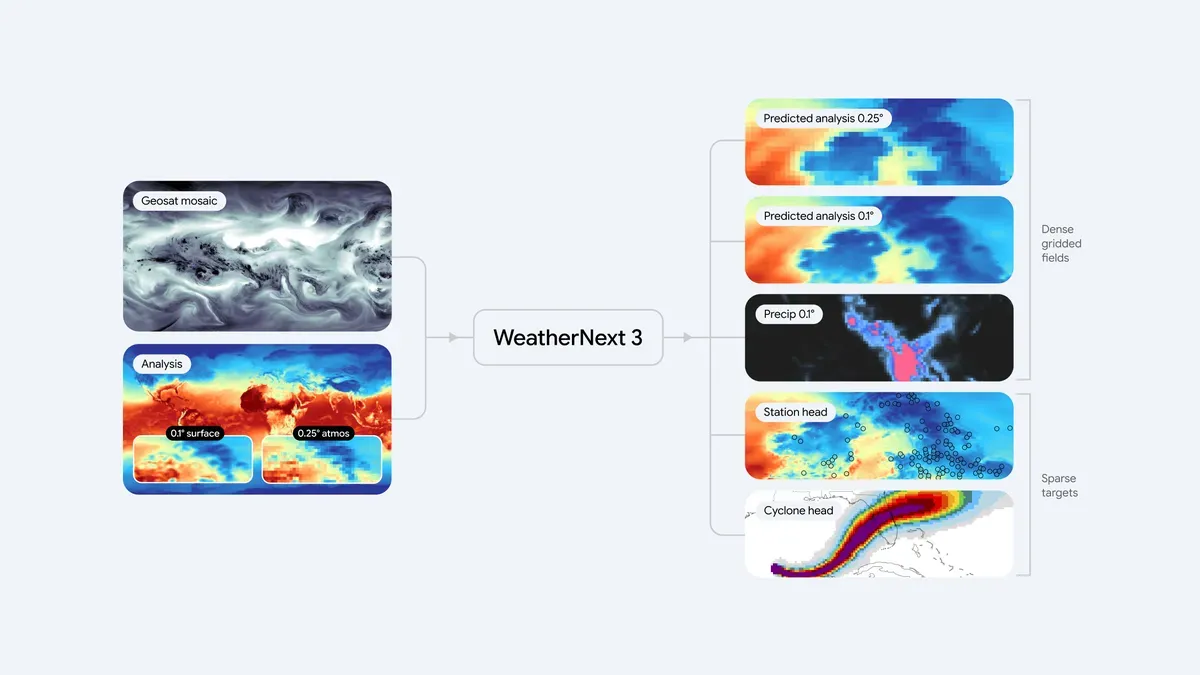
Weather forecasting has never been a single model producing a single truth. It is a chain of observations, numerical simulations, post-processing and distribution. Google’s announcement describes a change in that chain. Earlier WeatherNext models were trained on data from numerical weather prediction systems. Those systems remain valuable physics-based references, but Google says the data feeding earlier AI models carried a six-hour lag. WeatherNext 3 is presented as learning directly from live, global geostationary satellite data, alongside historical analysis and sparse station observations.
That distinction is more meaningful than the word “AI” in the headline. A periodic product can be accurate at its design resolution and still be late for a fast-moving rain band. An observation-driven system attempts to shorten the path between what is visible in the atmosphere and what an application can query. Google says WeatherNext 3 can produce a new forecast every hour, at up to 5-kilometre resolution. It also describes a single Functional Generative Network mesh transformer that accepts the live satellite mosaics and produces dense fields, cyclone tracks and station-level predictions.
The practical architecture is therefore closer to a streaming signal pipeline than to a static forecast file. Satellites provide a changing observation layer. The model maps that layer into forecast fields. Products and APIs expose selected variables to applications. Each layer has its own failure modes: missing observations, cloud or sensor artefacts, model uncertainty, API limits, local calibration and business rules. Calling the whole chain “the weather forecast” hides the engineering work that determines whether it is useful.
For a CTO, this is the first question to ask: which decision becomes better because the signal arrives hourly instead of every six hours? If there is no decision with a measurable threshold, higher resolution is an attractive demo rather than an operational improvement.
Resolution helps only when the decision is local
WeatherNext 3 reports temperature and moisture at 5-kilometre resolution, other surface variables at 10 kilometres and atmospheric variables such as wind speed at 25 kilometres. Google characterises the overall picture as roughly five times sharper than WeatherNext 2, which it describes as operating on a 25-kilometre grid with six-hour increments. The source also shows a UK temperature comparison in which finer terrain detail produces a less smoothed representation.
The shift matters where geography changes the answer quickly: coastlines, valleys, hills and urban edges. A 25-kilometre cell can blur the operational difference between a dry warehouse site and a wet nearby ridge. A 5-kilometre grid can represent more local variation, but it does not turn a grid cell into a sensor at your exact address. The output remains a modelled estimate, and the business still needs to understand how the coordinate, elevation, land cover and nearby observations affect it.
Consider a European field-service company scheduling outdoor maintenance. A region-level rain probability may support broad staffing decisions. It should not automatically trigger a cancellation for one worksite until the company has compared forecasts against its own locations, lead times and safety policy. The right test is not “is this forecast more detailed?” It is “does this forecast reduce unsafe dispatches or unproductive travel without creating too many false cancellations?”
WeatherNext 3 should therefore be treated as a data product, not a magic endpoint. Store the forecast version, issue time, requested coordinates, lead time and observed outcome. Without that record, teams will remember dramatic failures and forget ordinary useful forecasts. Operational trust requires a backtest, not a screenshot.
Precipitation is where the marketing claim meets reality
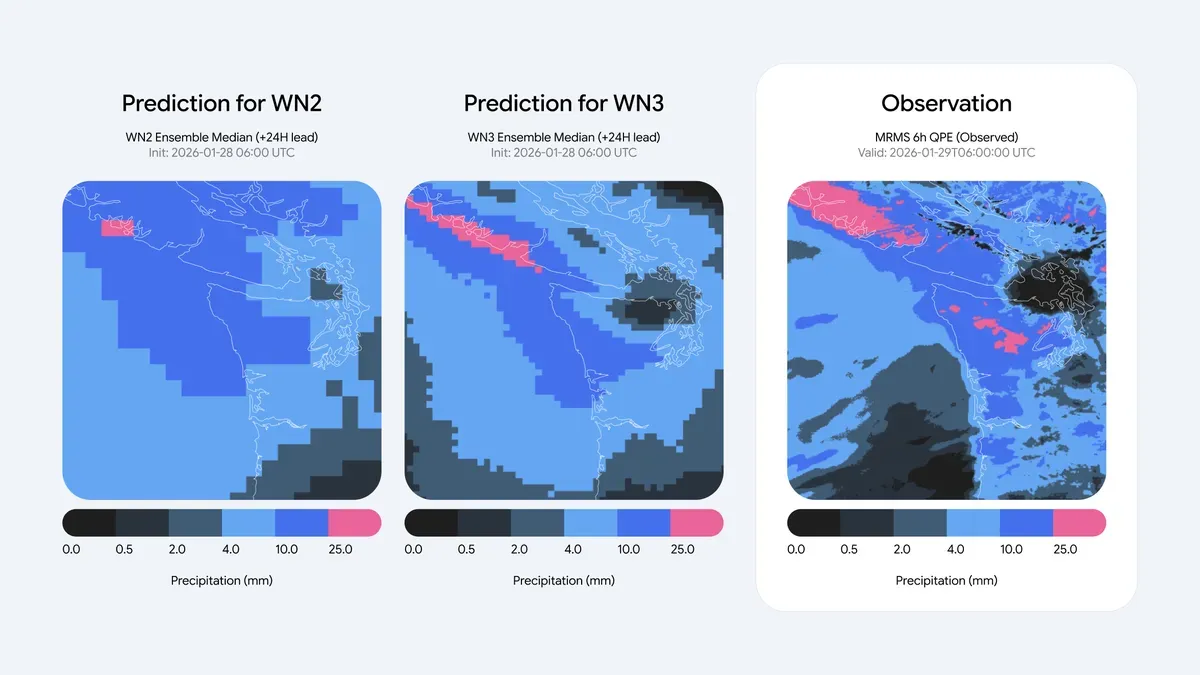
Rain and snow are difficult precisely because the useful boundary is small, mobile and consequential. Google says WeatherNext 3 was trained on NASA’s Integrated Multi-satellite Retrievals for GPM data and Google’s own global precipitation reanalysis based on satellite radar. It reports improvements in Continuous Ranked Probability Score of up to 60% against IMERG, 30% against MRMS and 10% against rain-gauge measurements for early lead times.
Those are attributed figures from Google’s announcement, not an independent Netics validation. The company also says day-ahead precipitation forecasts can be up to 50% more accurate in regions where previous forecasts were less reliable. That claim is potentially important for businesses, but “up to” is not a contract-level guarantee, and a global average or selected regional improvement does not tell a French logistics operator what happens on its routes.
A serious pilot should compare WeatherNext 3 with the incumbent service and the relevant national meteorological authority over a fixed period. Measure calibration, not only hit rate: when the system says there is a 70% chance of rain, does rain occur roughly 70% of the time for the chosen locations and lead time? Track false alarms, missed events, forecast latency, API availability and the cost of each wrong decision. For safety-critical weather, keep official warnings and local agency guidance in the control loop. A model can improve a planning signal without replacing public alerts.
The evidence discipline mirrors a wider Netics position: production AI starts beyond the model. The model is one component. The operational system includes data contracts, monitoring, human escalation, rollback and an owner who can explain what happened after a bad forecast.
Clean-energy variables make the system more operational
WeatherNext 3 is also designed around energy use cases. Google describes forecasts for 100-metre wind speeds, roughly turbine height, plus high-resolution cloud cover and solar radiation. Those variables are intended to help renewable-energy operators estimate production and match it with demand.
These variables fit enterprise workflows better than a generic “weather score.” A solar operator does not need an attractive map; it needs an estimate of irradiance for a site, a time window and an asset whose output curve is known. A wind operator needs a relationship between forecast wind at an indicated height and actual turbine production. Grid planning adds another layer: the forecast must be joined to asset availability, curtailment, demand and market rules.
For smaller organisations, that may mean consuming a prepared Google Cloud dataset rather than training a weather model. The source says developers and businesses can query data through BigQuery and Earth Engine or bulk-download it from Google Cloud Storage. This lowers the barrier to experimentation, but it also increases the risk of building an expensive pipeline before proving the business case. Start with one asset class and one decision. Do not ingest every variable because it is available.
The cost model matters as much as accuracy. Include storage, query volume, transformation jobs, egress, dashboards, engineering time and the cost of retaining historical forecasts for evaluation. If an hourly pipeline is more accurate but consumes more cloud budget than the avoided operational loss, it is not a win.
What European SMEs should validate before automating
A useful WeatherNext 3 evaluation can fit into a controlled operational pilot. First, define the decision: dispatch, delivery promise, inventory buffer, staffing, maintenance, irrigation or renewable output. Name the time horizon and the action threshold. “Better weather data” is not a testable requirement.
Second, create a location and data contract. Record coordinates, time zone, elevation where relevant, units, update timestamp, lead time, missing-value behaviour and the exact variable used. Confirm whether the Google surface you plan to use exposes the resolution and cadence described in the announcement for your region and commercial plan. Marketing-level global availability is not the same as identical access, terms or quotas everywhere.
Third, run a shadow period. Let the forecast inform a proposed action while the existing process remains in control. Compare the proposal with what operators did and what actually happened. This is where local microclimates, route geography and company-specific tolerance become visible.
Fourth, build a degradation path. What happens when a satellite mosaic is late, the API is unavailable, a forecast is obviously inconsistent or the local authority issues a warning that conflicts with the model? The safe answer is not to keep the last value indefinitely. Define expiry, fallback source, manual review and audit logging.
Finally, set a stopping rule. If the pilot does not improve the chosen metric after a defined period, stop the integration. If it does improve it, expand one workflow at a time and keep measuring. Weather uncertainty is not eliminated by machine learning; it is managed by making uncertainty visible at the point of decision.
The forecast is becoming a service, not a report
WeatherNext 3 points toward a broader architecture shift in applied AI. The valuable system is no longer a report generated on a fixed schedule and consumed passively. It is a live observation loop, refreshed as reality changes and connected to decisions that have owners, thresholds and consequences.
That is promising for European SMEs because the first beneficiaries do not need a research department. They need one well-defined operational question and enough discipline to measure it. A logistics firm can test rain-triggered dispatch rules. A facilities company can test outdoor work windows. An energy developer can test production estimates against telemetry. None should automate safety or financial commitments on the strength of a vendor benchmark alone.
Google has supplied an ambitious model and a distribution path across Search, Gemini, Maps, Google Maps Platform, Earth Engine and Cloud. The Netics view is more restrained: the architectural idea is important, but the business value begins only when a local forecast is tied to a local decision and validated against reality. Netics works with teams turning promising AI systems into controlled operations. Start there, keep the fallback, and let the evidence decide how much automation the signal deserves.
Sources
- Introducing WeatherNext 3, our most advanced and accurate global weather AI model — Google, 3 September 2026.
- WeatherNext 3 research paper — arXiv, 2026.
- WeatherNext developer documentation — Google Developers, accessed 13 September 2026.
- Weather Lab — Google DeepMind, accessed 13 September 2026.