
Core Web Vitals Field Data Measures What Real Visitors Experience
"Core Web Vitals report LCP, INP and CLS from real Chrome page loads at the 75th percentile, and the thresholds only mean something once you know which segment and which percentile you are r


TL;DR
- Core Web Vitals are a set of three page-experience metrics that Google reports from real Chrome usage, and they describe how visitors actually experience loading, interactivity and visual stability.
- The three metrics answer three different questions about one visit: Largest Contentful Paint for loading, Interaction to Next Paint for interactivity and Cumulative Layout Shift for visual stability.
- A page is judged on the 75th percentile of page loads, segmented across mobile and desktop, so the reported number describes nearly every visit and leaves the slowest tail out of the verdict.
- INP measures every click, tap and keyboard interaction a visitor makes, reports the longest one, drops one highest interaction for every 50, then takes the 75th percentile of page views.
- CrUX publishes those distributions for origins and pages that are publicly discoverable and sufficiently popular, which is why a staging host and a low-traffic landing page can show no field data at all.
- Reading a field report means naming the metric, the side of the threshold, the segment and the percentile, because those four facts change what a single number means for the work that follows.
- The thresholds provide a starting point for a conversation with the people who own the site, and a separate guide presents citable website work as the other half of the same problem.
Three metrics answer three different questions
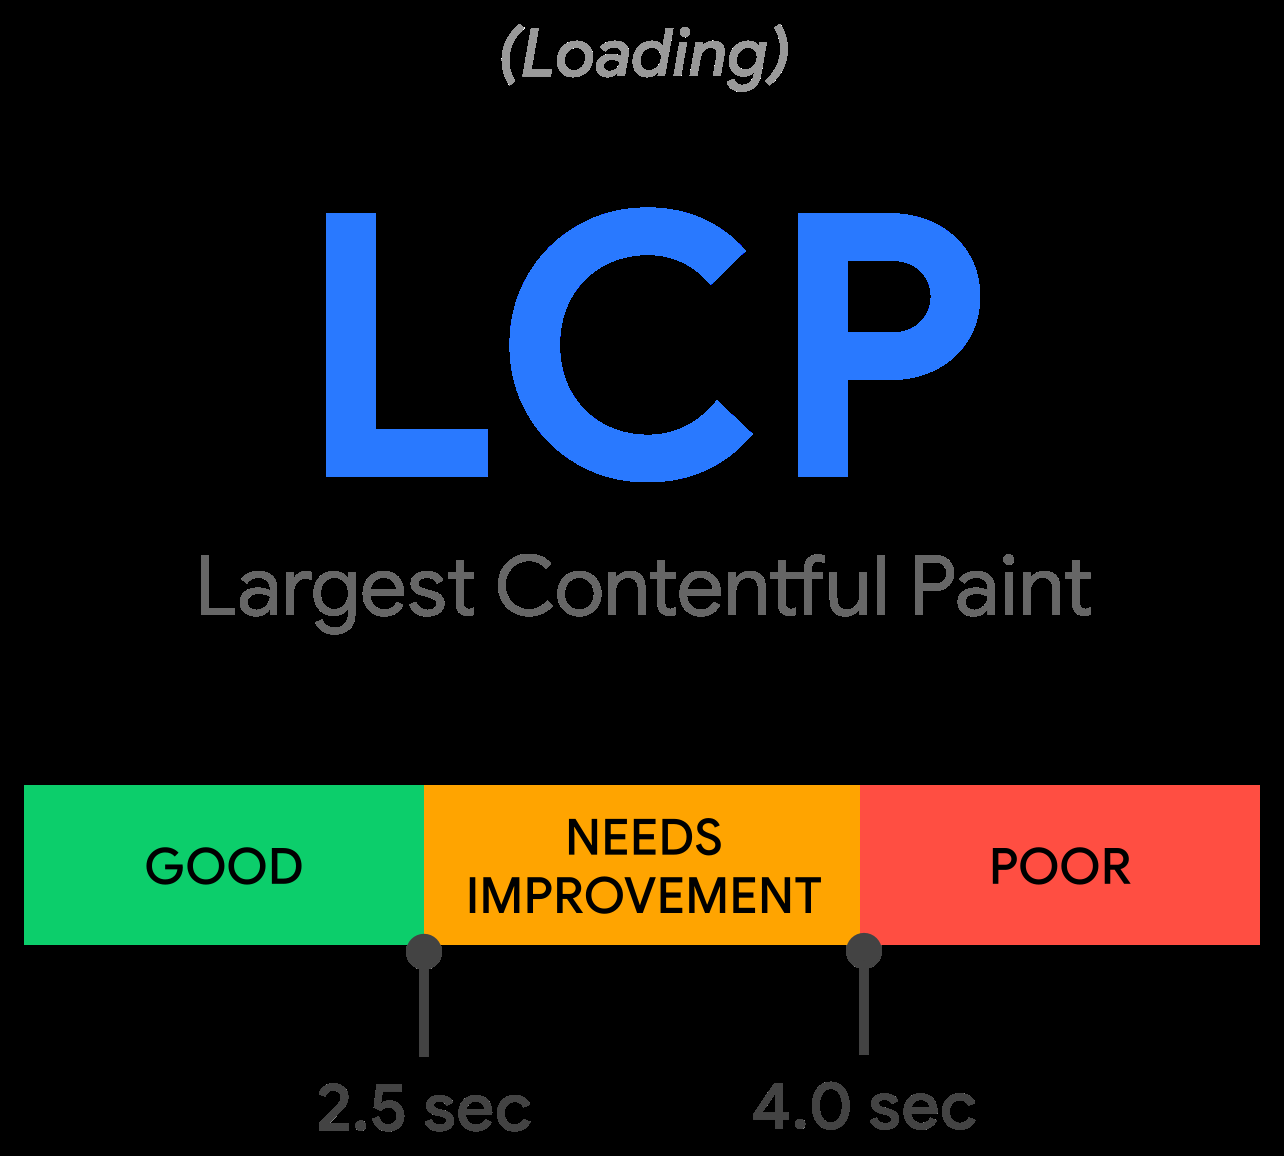
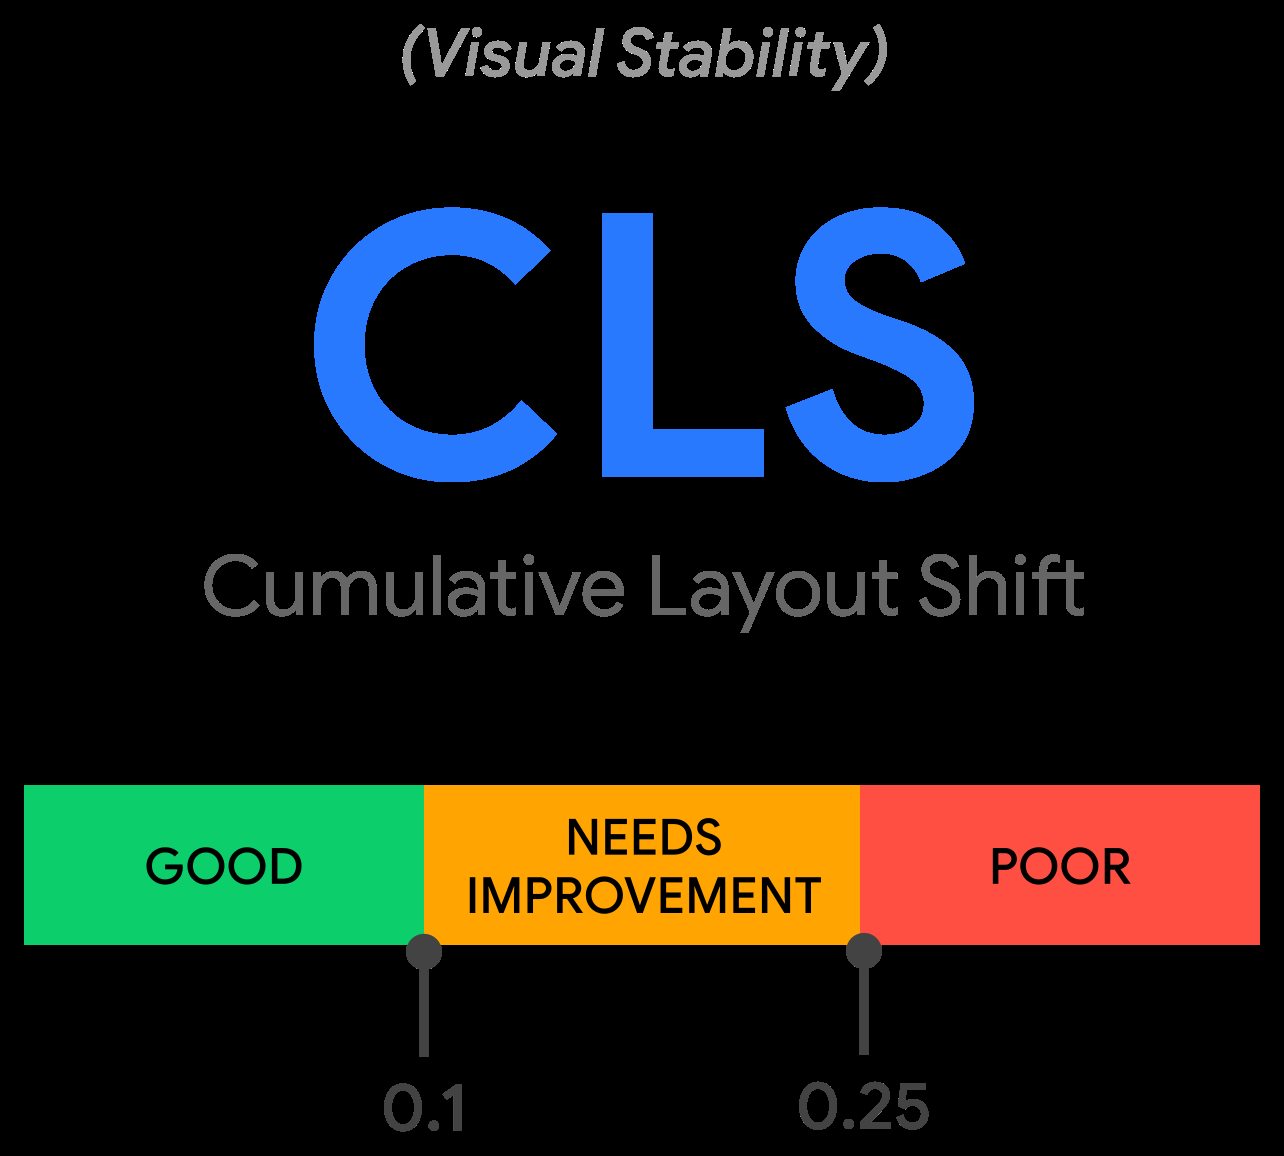
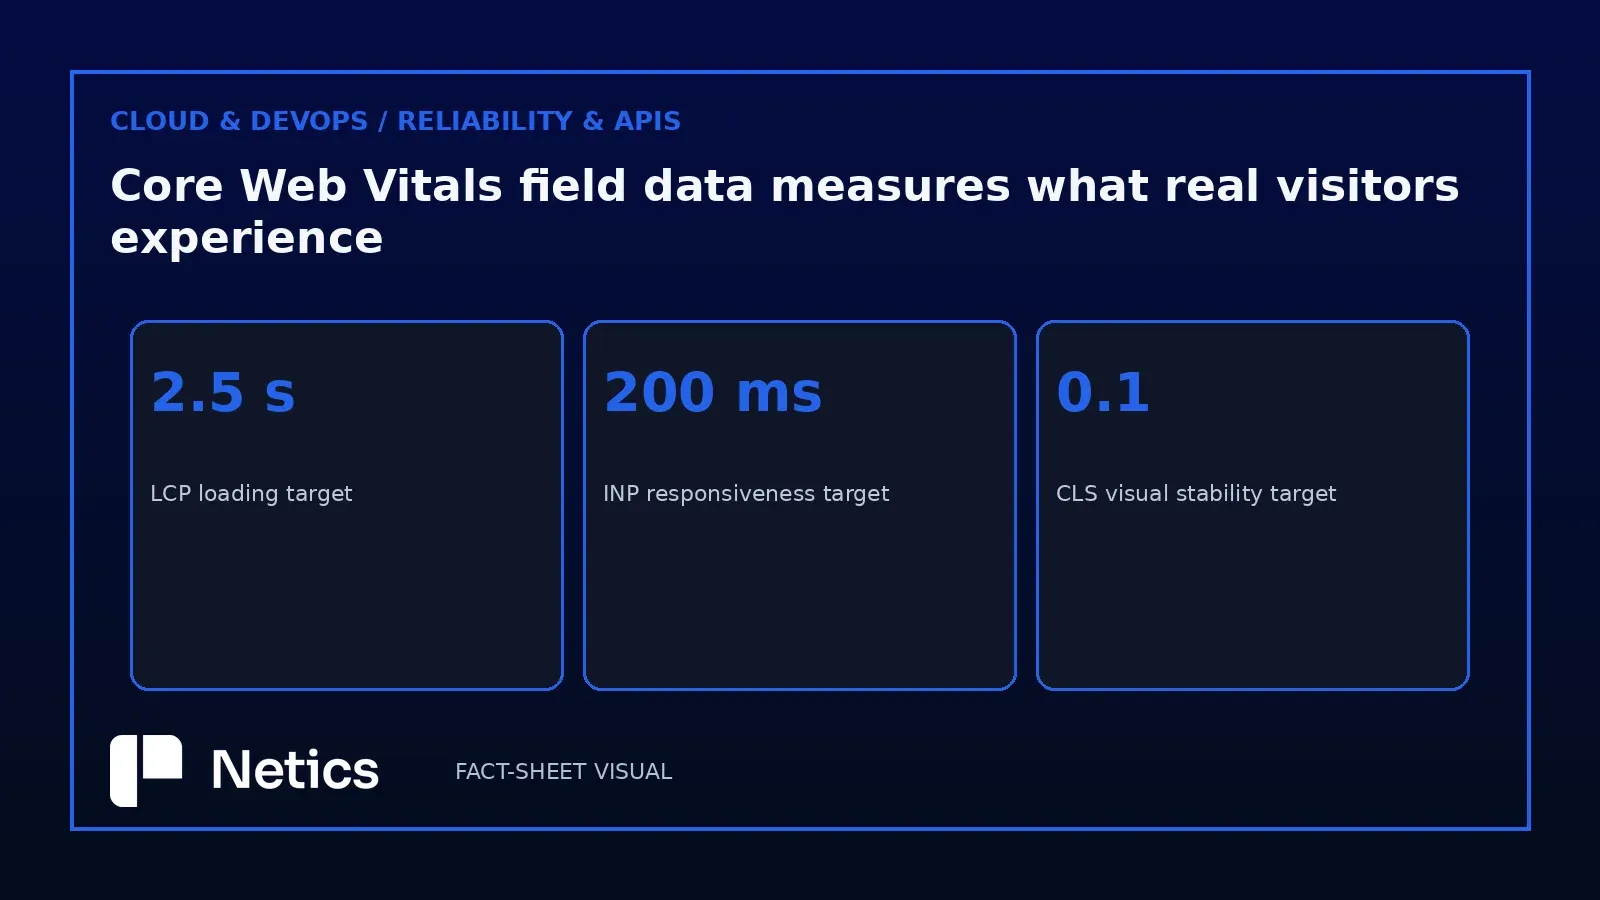
The Web Vitals article defines the set plainly: Largest Contentful Paint measures loading performance and should occur within 2.5 seconds of the moment the page starts loading, Interaction to Next Paint measures interactivity with 200 milliseconds or less as the target, and Cumulative Layout Shift measures visual stability at 0.1 or less. Each metric covers one slice of the visit, and each slice fails in a different way: a menu tap can remain unresponsive after a fast main-content paint; late fonts and images can shift text after an instant response.
Treating the three as one score hides that difference. Preloading a hero image targets LCP, shortening a long JavaScript task targets INP, and CLS requires its own remedy. The metrics are published separately because the remedies are separate.
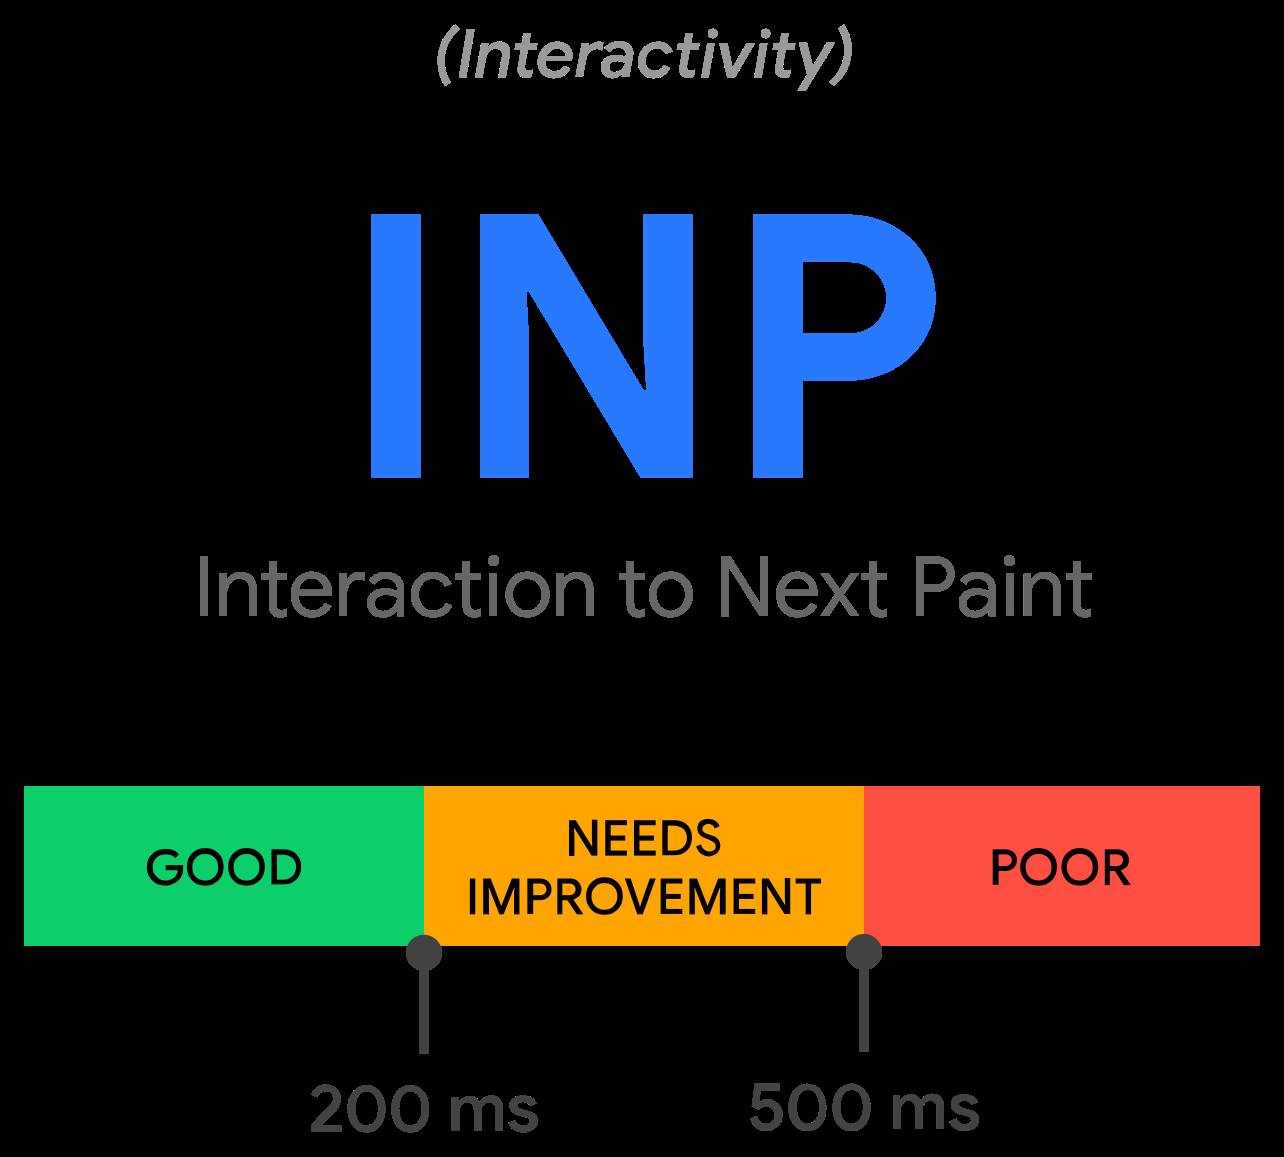
The thresholds themselves are the least interesting part of the standard, and they are the part most often quoted alone. A threshold turns a measurement into a label, and a label helps an operator only once the measurement behind it is understood. Three values on a chart say nothing about whether the slow visits come from a phone on a congested network or from a checkout page with a third-party script on every keystroke.
A practical review can treat the three metrics as separate budgets with separate owners. Loading work touches image formats, server response and render-blocking resources. Interactivity work touches JavaScript execution and how much of it runs on the main thread. Stability work touches layout reservation, font loading and how late content is inserted. Allocating one owner for "performance" usually leaves all three budgets unattended.
The 75th percentile describes nearly every visit
web.dev recommends measuring the 75th percentile of page loads, segmented across mobile and desktop devices, as the threshold to hold most users to. The percentile answers a practical question: what did almost everyone get? This threshold checks whether the recommended targets are met for most users.
Segmenting by device matters for the same reason. Mobile and desktop sessions differ in CPU headroom, network conditions and how the page is used, so a single pooled number blends two populations and hides the one that usually needs the work. The article's guidance is explicit about splitting them.
The practical consequence is that a field report has more than one headline number, because each device segment carries its own distribution and its own 75th-percentile value. A team can be inside the good band on desktop and in needs-improvement on mobile for the same metric on the same page, and both readings are correct. Publishing the pair with the mobile value first keeps the device segment visible in every review and foregrounds the experience of visitors using the site on a phone.
CrUX keeps only publicly discoverable, sufficiently popular origins

Chrome's CrUX methodology explains where field data comes from and, more usefully, when it does not exist. User experiences are aggregated into page-level and origin-level distributions, and an origin enters the dataset only when it is publicly discoverable and sufficiently popular, judged against a minimum popularity threshold. Pages and origins are added or removed automatically as they meet or miss those rules.
Two consequences follow. A site behind a login, or a staging host kept off the public web, contributes no field data to CrUX. A small marketing page can be publicly discoverable and still fall under the popularity threshold, which means the numbers an operator sees on a dashboard for that page may belong to the whole origin.
An origin-level number is a weighted view of everything the origin serves: the homepage, a campaign landing page, a slow checkout, a PDF viewer. An origin-level report describes eligible user experiences aggregated across all pages on that origin. Before acting, check which of the two levels the dashboard is showing, because a page-level fix on a page that only appears inside the origin-level aggregate cannot be verified from that aggregate.
What INP measures inside a single interaction
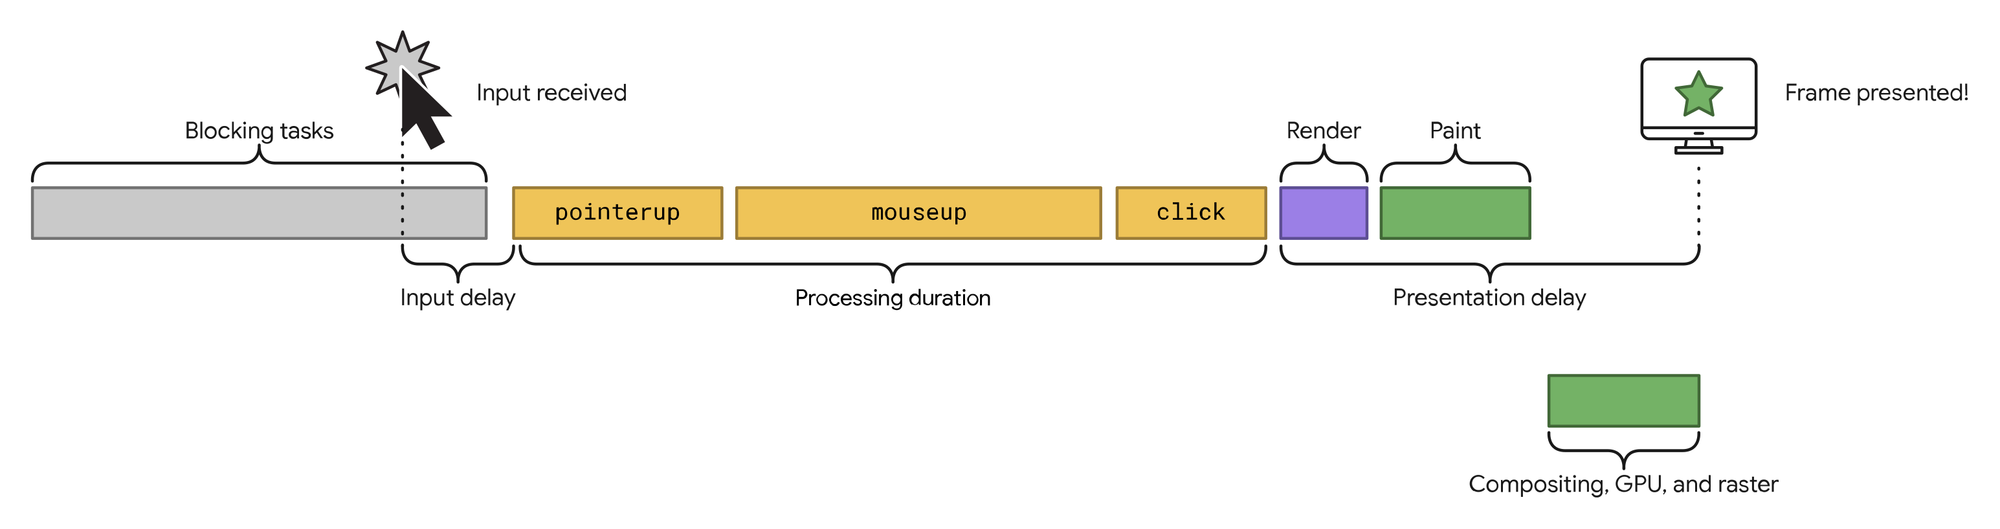
The Interaction to Next Paint article gives the metric a precise job: it observes the latency of every click, tap and keyboard interaction during a visit and reports the longest one, with one highest interaction ignored for every 50 interactions so a single random hiccup on a busy page does not define it. The 75th percentile of page views is then reported, which trims the tail again.
An interaction's latency has three parts. Input delay covers the time before the handlers start, usually when the main thread is busy with other work. Processing duration covers the handlers themselves. Presentation delay covers the time from the end of the handlers to the next frame the browser paints. The article is careful about scope: INP measures the time until the next paint is blocked, and the later effects of the interaction, such as a network fetch or a background update, sit outside the measurement.
That scope explains a common disagreement. A developer shortens the handler and sees no improvement, because the input delay came from a long task queued before the tap. Another shortens the fetch and sees nothing, because the fetch happens after the paint INP measures. The fix usually lives in the main thread's task queue, and the article's own guidance points at long tasks and input delay as the two places to look.
The metric also replaced an earlier measure. First Input Delay only looked at the first interaction, and web.dev records that INP was developed as an experimental metric to address runtime performance problems more comprehensively than FID did. For an operator, the change means the interactions deeper in a session, the ones that follow a search filter or a cart update, now count toward the reported value.
Reading a field report that names the metric and the segment
A field report becomes useful when four facts travel with the number: the metric, the side of the threshold the page sits on, the segment, and the percentile. Naming those four avoids the most common wasted sprint, in which a team improves a metric already in the good band while the real loss sits in another metric on another device.
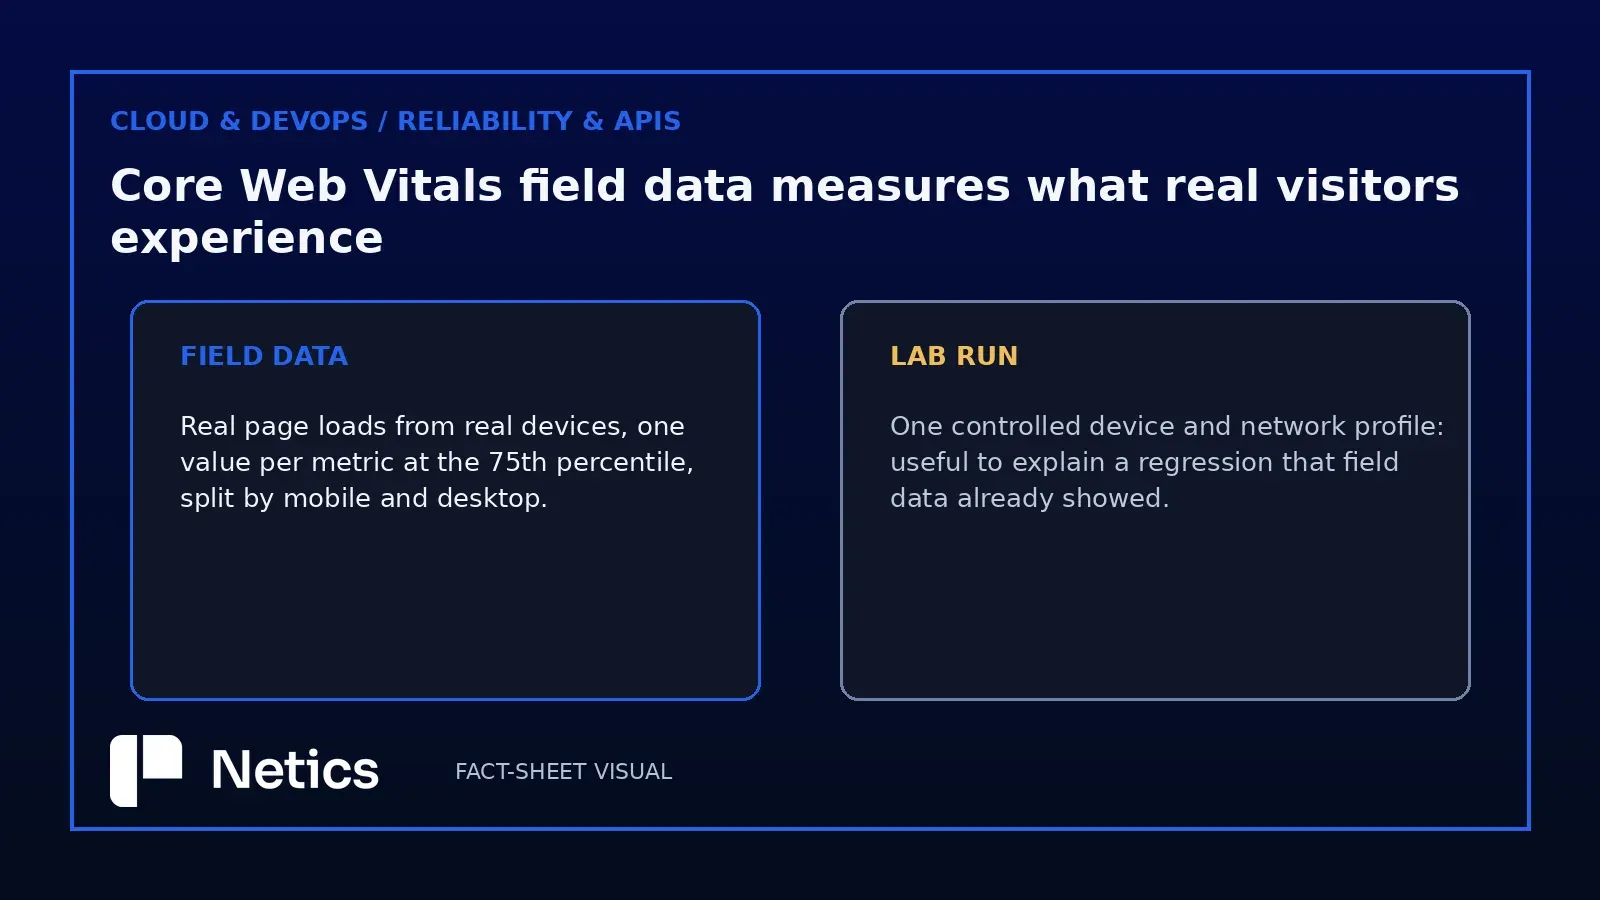
A weekly performance review can combine field data from visitor experiences across devices and networks with a controlled lab reproduction. The weekly review can keep the measurement scope visible with the [CrUX methodology](https://developer.chrome.com/docs/crux/methodology). Chrome documents the field-data methodology in its [CrUX documentation](https://developer.chrome.com/docs/crux/methodology). A bug report can attach one controlled lab reproduction to field evidence from visitors across devices and networks. Using the lab number as the verdict produces the familiar situation where a site scores well on a synthetic test and visitors still complain.
To review your site's field data, [start with the CrUX eligibility rules](https://developer.chrome.com/docs/crux/methodology). Confirm the host is publicly reachable and popular enough to appear in field data. Read the mobile value at the 75th percentile for each of the three metrics. Rank the metrics by how far they sit from their band, weighted by how much traffic the affected pages carry. Then choose one metric, one page group and one owner, and measure the same four facts again after the change. For more information about Netics, visit [Netics](https://neticslabs.com/) or [the booking page](https://neticslabs.com/#booking).
For teams, a field report can serve as a shared reference between the people who build the page and the people who own the business result. When a team wants to go through its own numbers, review the four facts above and bring the CrUX view for one origin.
Sources
Source: Web Vitals — web.dev, https://web.dev/articles/vitals, retrieved 2026-11-15. Companion: Interaction to Next Paint (INP) — web.dev, https://web.dev/articles/inp, retrieved 2026-11-15. Companion: CrUX methodology — developer.chrome.com, https://developer.chrome.com/docs/crux/methodology, retrieved 2026-11-15.